What is the variance analysis cycle?
The variance analysis cycle is a structured process of comparing actual results against planned figures to understand why financial performance didn't match expectations.
Imagine you built a budget for materials, labor, and overhead, then costs started climbing halfway through the period. The variance analysis cycle helps you pinpoint what changed.
Maybe supplier prices increased. Maybe productivity slipped. Maybe an unexpected event affected operations.
By working through the cycle, you can:
- Spot performance issues early: Identify whether a variance comes from pricing, volume, efficiency, or external factors.
- Make better decisions: Use the insight to improve budget allocation and sharpen your forecasting and planning processes.
- Improve future performance: Apply what you learn to strengthen your planning process over time.
What are the steps in the variance analysis cycle?
The variance analysis cycle is a framework for understanding why your financial results might differ from what you originally planned.
Here are the key steps to follow:
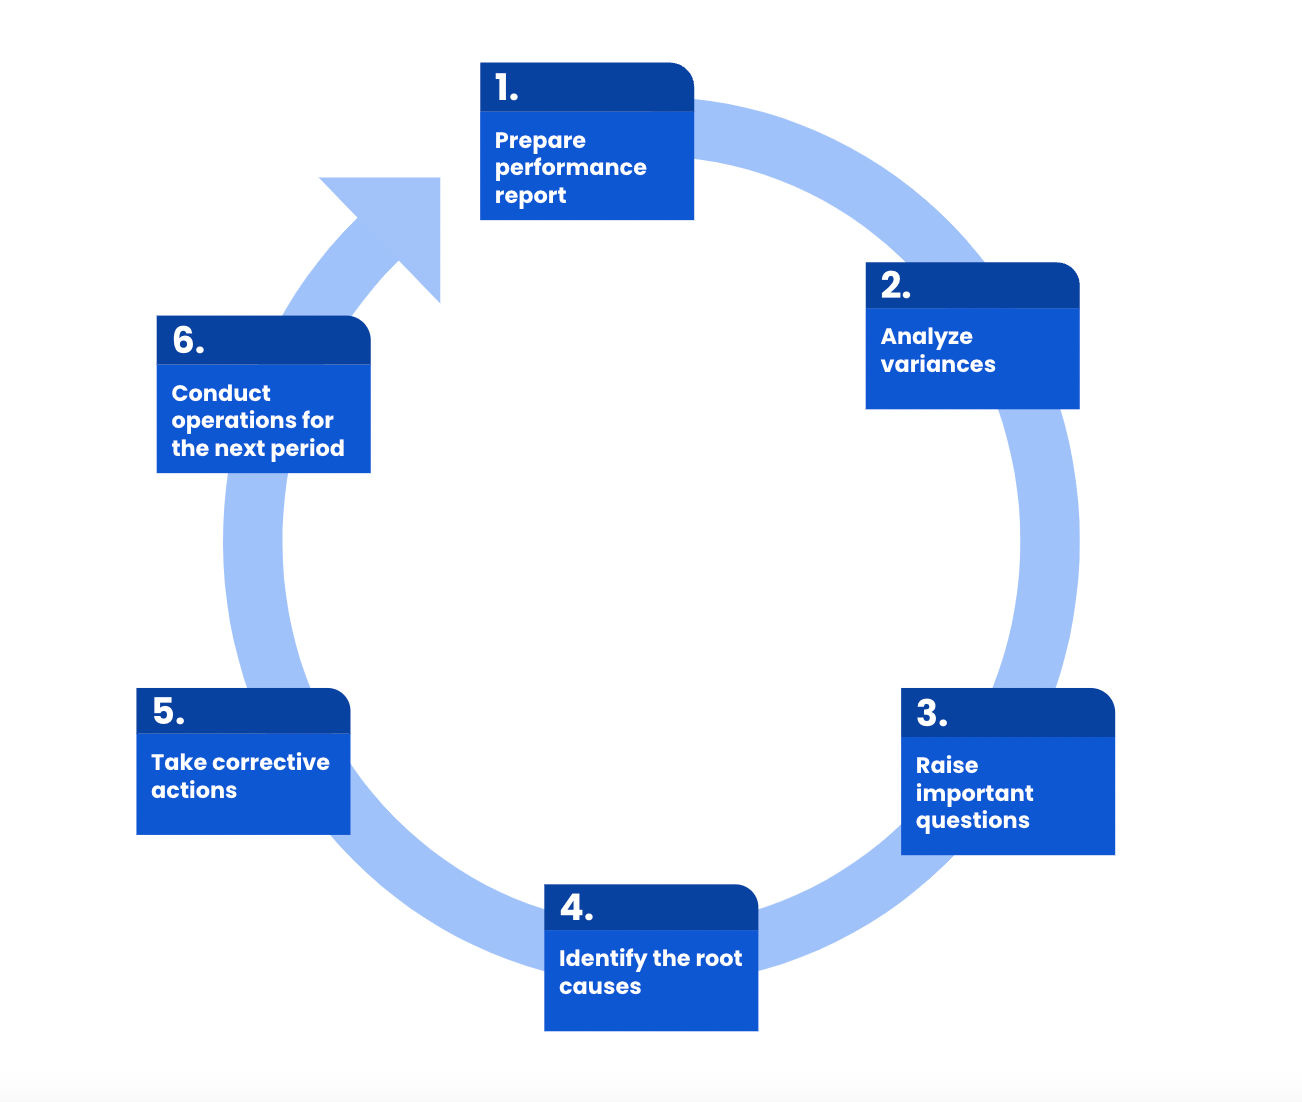
1. Prepare performance report
Document everything in a clear performance report. This includes:
- Any variances you found
- Why you think they happened
- What steps you took to address them
- The results of those actions
By doing this, you'll create a baseline for identifying and quantifying any variances. Your performance report serves as valuable documentation and helps guide future decision-making.
2. Analyze variances
Once the performance report is prepared, the differences between the actual results and budgeted values are calculated. This analysis helps identify potential areas of concern and efficiency.
3. Raise important questions
Next, compare your budget or forecasts to your actual results. Where do you see differences?
Don't just note the numbers, start asking questions:
- Why are our expenses higher than we thought?
- Did something cause our sales to fall short?
- Are there unexpected factors dragging down our profits?
4. Identify the causes
Once you have a list of questions, it's time to dig deeper and identify the root causes of the variances. This involves gathering data, analyzing trends, and conducting various 'investigations'.🕵🏼♂️
You might need to:
- Review historical data to identify patterns and trends.
- Consult with operational teams to understand specific challenges and inefficiencies.
- Analyze market data to identify external factors influencing performance.
5. Take corrective actions
Based on your findings, it's crucial to take action to address the identified variances. Possible actions resulting from the variance analysis cycle may involve:
- Implementing corrective measures to improve efficiency, reduce costs, or boost sales.
- Reallocating resources to capitalize on opportunities or mitigate risks.
- Revising budgets and forecasts to reflect new realities and insights.
6. Conduct operations for the next period
By the time you've reached this step, you've got enough knowledge to tackle the next period's operations with a more informed approach.
Think about applying what you learned to help set more achievable targets, allocate resources better, and implement proactive measures to prevent future variances.
Remember, the variance analysis cycle is about continuous improvement. By asking the right questions, finding the root causes of differences, and taking appropriate action, you can make your financial planning and performance better over time.
The formula behind the analysis
The variance analysis cycle relies on a specific formula to quantify the difference between budgeted and actual results.
Let's break down the formula itself, how to use it in Excel, and explore specific variations…
What is the formula for variance analysis?
The core formula for variance analysis calculates the difference between the budgeted (or planned) value (B) and the actual value (A):
Variance = Actual (A) - Budgeted (B)
This straightforward formula provides a basic understanding of how much your results deviated from your expectations.
However, for a deeper analysis, we need to consider different types of variances, leading to more specific formulas.
What is the formula for variance analysis in Excel?
Excel offers various built-in functions to calculate variances depending on what you're analyzing and whether you're dealing with the entire population or a sample:
Population variance: Use the VAR.P (range) function, where "range" refers to the cells containing your data.
Sample variance: Use the VAR.S (range) function.
Price variance: This calculates the difference between the actual price paid (AP) and the budgeted price (BP) multiplied by the actual quantity (Q):
Price Variance = (AP - BP) * Q
Quantity variance: This calculates the difference between the actual quantity (Q) and the budgeted quantity (BQ) multiplied by the budgeted price (BP):
Quantity Variance = (Q - BQ) * BP
Variance analysis by time period
Variance analysis becomes more useful when you choose the right comparison period. Different time frames highlight different types of performance changes.
Month-over-month (MoM)
Month-over-month analysis compares one month to the previous month. It helps you catch short-term shifts like seasonality, sudden cost increases, or the early impact of a pricing or staffing change.
Quarter-over-quarter (QoQ)
Quarter-over-quarter analysis smooths out monthly noise and gives you a clearer view of sustained trends. It's especially useful for leadership reporting and broader performance reviews.
Year-to-date (YTD) vs forecast
A YTD comparison shows how cumulative actual results stack up against your forecast so far. This helps you assess whether you're on track to hit annual goals or need to revise expectations.
Actual vs rolling forecast
Rolling forecasts update as new information becomes available. Comparing actuals to a rolling forecast gives you a more realistic benchmark than relying only on a static annual plan.
Types of variance analysis
The variance analysis cycle dives deeper by focusing on specific areas within your budget. This lets you pinpoint the root causes of variances much better.
Below, we'll explore three common types of variance analysis: material, labor, and overhead variances.
1. Material variance analysis
This focuses on understanding the difference between the actual cost of materials used (ACM) and the budgeted cost of materials (BCM) for the actual quantity (Q) used:
Material Variance = (ACM - BCM) * Q
This variance can be further broken down into price variance (difference between actual and budgeted price per unit) and quantity variance (difference between actual and budgeted quantity used).
2. Labor variance analysis
This examines the difference between the actual cost of labor (ACL) and the budgeted cost of labor (BCL) for the actual hours worked (AH):
Labor Variance = (ACL - BCL) * AH
Like material variance, this can be further analyzed as labor rate variance (difference between actual and budgeted hourly wage) and labor efficiency variance (difference between actual and budgeted hours worked for a given output).
3. Overhead variance analysis
This analyzes the difference between the actual overhead cost (AOC) and the budgeted overhead cost (BOC):
Overhead Variance = (AOC - BOC)
Overhead costs are indirect and often fixed within a specific time period.
Therefore, this variance can be further categorized as fixed overhead spending variance (difference between actual and budgeted fixed overhead cost) and variable overhead spending variance (difference between actual and budgeted variable overhead cost per unit of activity).

How to calculate spending variance
Spending variance refers to the difference between the actual amount you spent and the amount you budgeted to spend.
To calculate spending variance, you can use this formula:
Spending Variance = Actual Spending - Budgeted Spending
Let's say you planned to spend $500 on marketing for the month. However, due to unforeseen circumstances, your actual spending reached $620. Plugging these values into the formula, we get:
Spending Variance = $620 (Actual) - $500 (Budgeted) = $120
In this case, the positive variance of $120 indicates that you overshot your budget by $120. This could be a cause for concern, prompting you to investigate further and take corrective actions.
Remember, variances can be favorable or unfavorable depending on the situation and your goals. By calculating and understanding spending variances, you gain valuable insights into your spending patterns and can make informed decisions to optimize your financial health.
What is budget variance analysis?
Budget variance analysis compares actual results to the original budget. It's a broader approach that doesn't necessarily consider standard costs and can be used for various expense categories, including materials, labor, and overheads.
What is the standard cost variance analysis?
Standard cost variance analysis compares actual results to predefined standard costs. Standard costs are predetermined estimates of what a cost should be under normal operating conditions.
This approach allows for a more detailed understanding of cost variances beyond simply comparing actuals to the budget.
Is variance positive or negative?
Variance itself isn't inherently positive or negative. It's simply the difference between what you expected (budgeted) and what actually happened. It's like the gap between your planned destination and the actual road you end up taking.
However, the context of the variance matters more:
If the actual cost comes in under budget (positive variance), that's a good thing.
But, if the actual cost is ***higher* than expected** (negative variance), that means you went over budget. This might not be ideal, but it helps you understand where you might need to adjust your spending in the future.
So, while the variance itself doesn't have a positive or negative sign, understanding the "why" behind the variance helps you determine if it's an opportunity to celebrate or a cause for further analysis and potential adjustments.
Can variance be zero?
Yes, a variance can be zero! This occurs when the actual results perfectly match the budgeted or planned figures.
In simpler terms, it means everything went exactly according to plan, with no surprises (either positive or negative) in terms of costs, revenues, or other financial metrics.
What causes an unfavorable variance?
An unfavorable variance happens when actual results fall short of expectations. That usually means costs were higher than planned, revenue was lower than expected, or both at the same time.
The next step is to identify the root cause. In most cases, unfavorable variances come from a small set of common drivers:
- Market fluctuations: Input prices, customer demand, or currency conditions changed unexpectedly.
- Operational inefficiencies: Delays, waste, rework, or poor resource allocation increased costs or reduced output.
- Pricing pressure: You had to discount more than planned or couldn't raise prices as expected.
- External events: Regulatory changes, supply chain disruptions, or other outside shocks affected performance.
- Human error: Mistakes in forecasting, budgeting, data entry, or execution created a gap between plan and reality.
Not every unfavorable variance signals a deeper problem, but each one should be investigated in context. A small overspend in one area may be manageable, while a recurring pattern can point to a broader planning or operational issue.
Are unfavorable variances always bad?
While unfavorable variances are generally unwelcome surprises, they're not always a bad thing.
Think of them as valuable wake-up calls, prompting deeper analysis of inefficiencies and corrective actions that ultimately lead to improved performance and future cost-saving opportunities.
The key is to view them as stepping stones toward ongoing financial optimization.
How to tell if variance is favorable or unfavorable
Imagine you budgeted to spend $100 on office supplies for the month, but only ended up spending $83. This favorable variance means you spent $17 less than expected, saving some precious cash.
However, the opposite scenario can also occur. If you budgeted $100 but ended up spending $123, you have an unfavorable variance. You overshot your budget by $23, a potential cause for concern.
Here's how you can tell if the variance is favorable or unfavorable:
- Favorable variance: Actual results are better than the budget (e.g., spending less than expected).
- Unfavorable variance: Actual results are worse than the budget (e.g., spending more than expected).
How to write a variance analysis report
Variance analysis reports are important for understanding why your financial results might differ from your plans. But how do you write a report that's clear, informative, and engaging?

Here are some tips to help you write a variance analysis report:
Structure:
1. Start with a strong introduction: Briefly introduce the report, stating the period analyzed and the key variances investigated.
2. Findings (show, don't just tell): Present the identified variances in a clear and concise format, like tables or charts. Include explanations for each significant variance, using clear and non-technical language.
3. Analysis: Dig deeper into the "why" behind the variances. Explain the root causes, using data, examples, or insights from discussions with relevant teams.
4. Action plan: Based on your analysis, propose specific actions to address the variances. This might involve cost-saving measures, pricing adjustments, or process improvements. Be clear about who is responsible for implementing each action item.
5. Wrap it up: Summarize your key findings and reiterate the impact of the variances on the organization's financial performance. Briefly mention any recommendations for future planning or process improvement.
Key components:
- Clarity is king: Use simple language, avoid technical terms, and explain any necessary jargon.
- Visual appeal: Use charts, graphs, or tables to present complex data efficiently and visually.
- Actionable insights: Don't just present the problems; provide concrete solutions and recommendations.
- Keep it concise: Aim for a focused report, avoiding unnecessary details or fluff.
By following these tips, you can create a powerful variance analysis report that informs and empowers your colleagues to make data-driven decisions.
FAQs: The variance analysis cycle
What is the variance analysis cycle?
The variance analysis cycle is a continuous process of comparing actual results to planned figures, analyzing the differences (variances), identifying root causes, and taking corrective actions to improve future performance.
How are variances investigated and resolved?
To investigate and resolve variances, you'd gather relevant data, analyze trends, consult with stakeholders from different departments to gain insights, identify the underlying reasons behind the variances, and develop and implement corrective actions like cost-saving measures, pricing adjustments, or process improvements.
What is the root cause of variance analysis?
The root cause of variance analysis isn't about finding blame, but rather about understanding why actual results differ from planned figures. This knowledge helps prevent similar issues and improve financial planning and decision-making.
What is unfavorable variance?
Unfavorable variance occurs when the actual results fall short of expectations compared to the planned figures, such as experiencing higher costs, lower sales, or lower efficiency levels.
Why do we need a variance analysis?
Variance analysis helps us understand why financial results differ from plans, identify areas for improvement within the organization, and make informed decisions about future plans, resource allocation, and adjustments to strategies.
What are the disadvantages of variance analysis?
While time-consuming and requiring skilled personnel to interpret data and take effective actions, variance analysis is crucial because it helps us understand and address the root causes of discrepancies, ultimately leading to better financial performance.
Why do variances occur?
Variances can stem from various factors, both internal (operational inefficiencies) and external (market fluctuations), and even human error.
How can variances be corrected?
Correcting variances depends on the identified root cause, but might involve implementing cost-cutting measures, adjusting pricing strategies, improving internal processes, or revising future plans and budgets.
Ready to master FP&A?
Variance analysis is just one piece of the FP&A puzzle. If you're serious about sharpening your forecasting, budgeting, and financial storytelling skills, FP&A Certified: Core is built for you.
Learn how to build accurate forecasts, turn complex data into strategic insights, and step into the role of a true business partner, all backed by industry experts from companies like Adobe, Philips, and Kyruus Health.
👉 Accelerate your career with FP&A Certified: Core and gain the tools, templates, and know-how to drive real business impact.


Become an FA Insider
Thank you for subscribing
Get exclusive insights, frameworks, and strategies from finance leaders driving real business impact.
An email has been successfully sent to confirm your subscription.
 Follow us on LinkedIn