Budget to actual variance analysis answers important questions that are vital to growth. Such questions include - why did one division, product, or service perform better (or worse) than another? Answering these questions helps businesses make strategic decisions around expenses, cost, budgets, etc.
But what is budget variance analysis? And, how do you calculate the difference between the budget and the actuals?
In this article, I’ll dive into a tactical analysis that is important to every CEO and CFO - the budget vs actual variance analysis. Keep reading to discover insights on these topics:
- What is budget vs actual variance analysis?
- The difference between budget, plan, actual, and forecast
- The elasticity of key business drivers
What is the budget vs actual variance analysis?
It is a comparison of your company’s planned financial performance (budget) compared against the final financial results (actual) for a given time period. The variance is the difference between the budget and actual. It's typically expressed as a percentage difference or total cash difference.
The purpose of variance analysis is to segment the business into its building blocks and understand how each block is performing.
In the process, we may encounter questions such as:
- Why are North America's sales selling our core product better than Europe sales? Is it because we don’t understand our European customers? Or, is it because the Europe sales team isn’t performing well?
- Why is sales efficiency down? Sales and marketing expenditure is up proportionally more than sales compared to the previous year. Is it a low-performing sales rep or an ineffective marketing campaign?
- Are the variances being driven by operational shortcomings? Or, are there macroeconomic changes that we weren’t prepared for? How should we adjust the forecast going forward?
Let’s consider an example where the company misses revenue targets by 8%. That’s not good... but now what? How does the CEO/CFO act on this information?
The real value is in the details. Total revenue is the summation of its parts.
A software company's revenue can be broken down into:
- Monthly subscription revenue
- Pay-as-you-go revenue
- Professional services revenue
- Proof of concept revenue.
Of course, this is just one example of how a company segments revenue. Revenue can also be segmented by customer location (geography) or customer industry (sector).
When we drill down, we may learn that North American sales beat expectations by 12% but Europe sales were down 20%. In this case, the CFO would need to talk to the Europe sales leader, rather than the entire sales organization.
Year-to-date (YTD) & full-year forecast
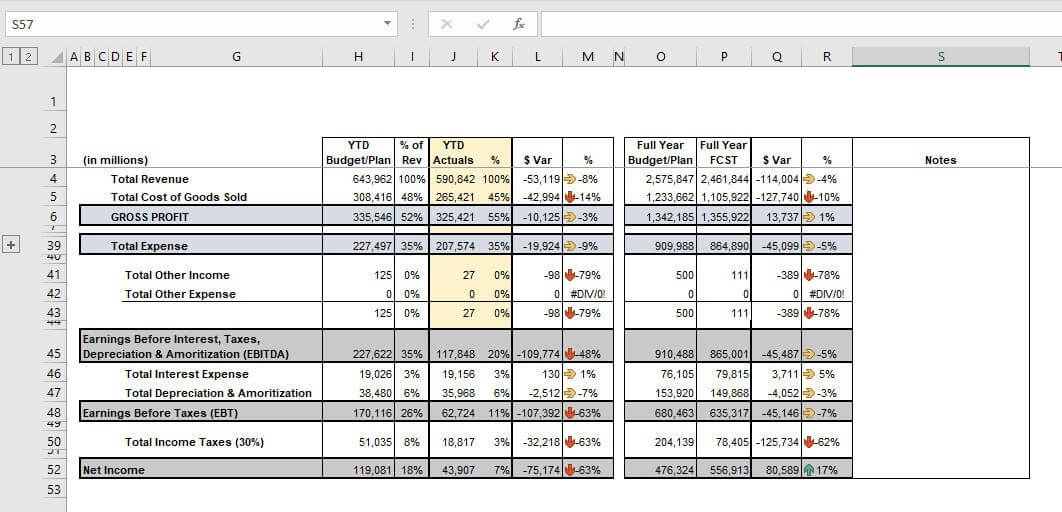
The image above is a sample budget vs actual variance analysis. The left section is budget vs actual performance year-to-date. On the right, you can see the full-year budget and forecast. If you're confused by the difference between budget, plan, actual, and forecast, let me explain...
- Budget & Plan are used interchangeably; they’re the same. Going into the new fiscal year, company management sets a financial plan. This includes sales targets and expense budgets.
- Actual is the financial performance that happens, which means it is backward-looking. The only way to have actual financials is if it has already happened.
- Forecast is the expected financial performance going forward based on new information. In the example above, the full-year plan for revenue is $2,575,847. But after one quarter, we can take our learnings and readjust the forecast. In this case, a shortfall in revenue coupled with other factors drove the full-year forecast for revenue down to $2,461,844.

The elasticity of key business drivers
The budget vs actual variance model is highly effective in helping managers understand the elasticity of key business drivers.
What does that mean?
Let’s take an enterprise software company as an example. Let's assume that the company's primary sales channel is direct to enterprise sales. The management hires a world-class outside sales team to approach every Fortune 500 company. To build a revenue plan, the managers assume one deal per quarter with an annual sales quota of $2.5M per sales representative. After the first quarter, we find the sales team meeting expectations. There is strong evidence to adjust the forecast up based on macroeconomic tailwinds.
How do we meet the new forecast? Should we increase the annual sales quota because we believe the sales team can achieve more? Or are the existing sales reps stretched thin and we need to hire new salespeople? How do we adjust for the ramp-up period (a sales rep with 12 months of experience selling our core product is more effective than someone with 3 months)?
These are questions we can answer by running a sensitivity analysis. This then helps us understand the elasticity of a key business driver.
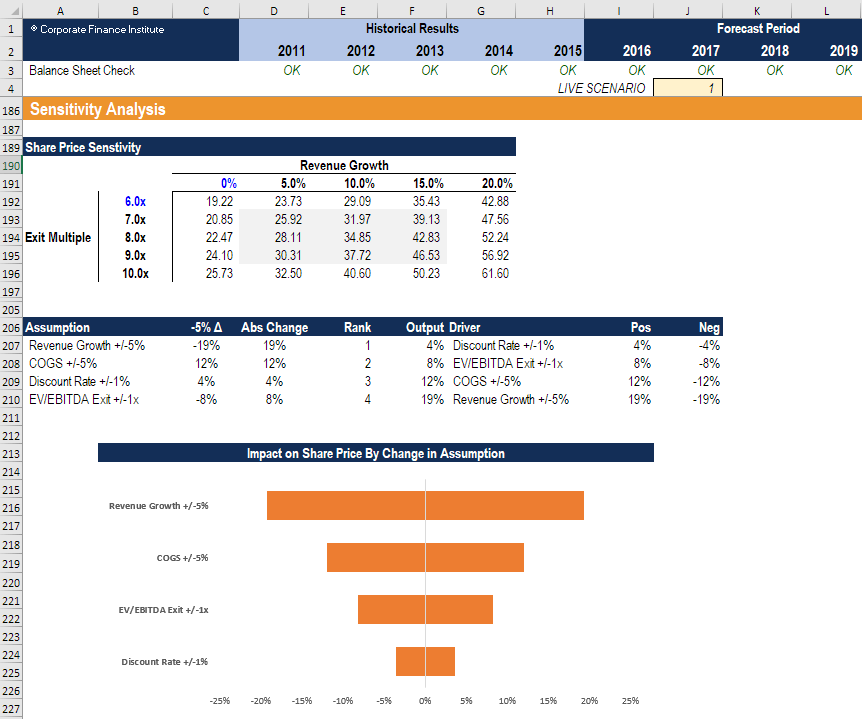
Each company has a unique set of variables that drive the business. For a consumer software product, it could be the stickiness of new features or the effectiveness of social media ads. For an enterprise software product, it could be the effectiveness of its customer success team. Or, the reach of its indirect channel partnerships. The key is to figure out the levers that drive your business. Then, you can run various A/B tests around those levers to optimize business performance.
A valuable tool, especially in today’s market
Today’s market is a tale of two streets:
1. Wall Street - where the S&P 500 index is only down 6% for the year.
2. Main Street - where the unemployment rate is nearing 25% with heightened social unrest.
All this is against the backdrop of the Covid-19 pandemic. Yet, it's also the most complex financial system we’ve ever known. All this combined creates the most unpredictable market we’ve ever been in.
I’m writing about this topic now because financial planning is more important than ever. Managers are constantly receiving new information that could justify changing the business strategy. The budget vs actual variance analysis is a valuable tool to analyze which business levers are most important and how to think about the months ahead. Performing regular budget vs actual comparisons will reveal trends in your operations that might’ve gone unnoticed.
If you'd like to read more insightful finance articles written by Alex Lee (co-founder & CEO of Bluelight), check out his other articles published here.
Searching for more resources and advice?
Sign up to our free Finance Alliance Slack community and start networking with other CFOs and finance leaders today!
Join our Slack community here.


Finance alliance insider
Thank you for subscribing
Level up your finance alliance career & network with finance alliance experts.
An email has been successfully sent to confirm your subscription.
 Follow us on LinkedIn