Connecting your forecasting to the company's strategic initiatives is a great way to make sure finance is playing a leadership role in moving the company forward. It's also a great way for an FP&A business partner to get more exposure and add more value.
In this article, I’ll cover:
- What is strategy?
- Top tools successful companies use to translate strategy into action
- What is driver-based forecasting and why is it important?
- Applying driver-based forecasting to a real-world example
- Changing the conversations your company is having about financial results
What is strategy?
It's surprisingly hard to find a good definition of strategy. But I prefer Patrick Lencioni’s definition in his book, ‘The Advantage.’
He says:
“An organization’s strategy is nothing more than the collection of intentional decisions a company makes to give itself the best chance to thrive and differentiate from competitors.”
If a strategy is the intentional decisions that a company makes, then having a good strategy means you've made some good decisions about what the company must do differently. But to be successful, you also have to successfully execute that strategy. That's the hard part.
The company has to translate that strategy into initiatives that someone in the company will own. And if brought about successfully, that’ll bring the desired result and financial impact.
So how do successful companies do that?
They start by using one of several tools to translate strategy into action. Let's look at some of those tools.
Top tools successful companies use to translate strategy into action
6 critical questions
Patrick Lencioni suggests creating clarity throughout the organization with six critical questions:
- Why do we exist? This is a really important anchoring question for strategy. Why do our customers and our suppliers need us between them? When companies lose sight of the role they play in the value chain, they’ll start to go in the wrong strategic direction.
- How do we behave? This question is about culture and values.
- What do we do? This is being clear about what business we’re in and knowing when we’re just chasing $1 and getting outside of our sweet spot or niche.
The last three questions are where the translation of strategy to action occurs.
- How will we succeed?
- What’s most important, right now?
- Who must do what?
Question four is the ‘what.’ What’s our strategy? Question five is the ‘how.’ How will we bring it about?
The 4 Disciplines of Execution
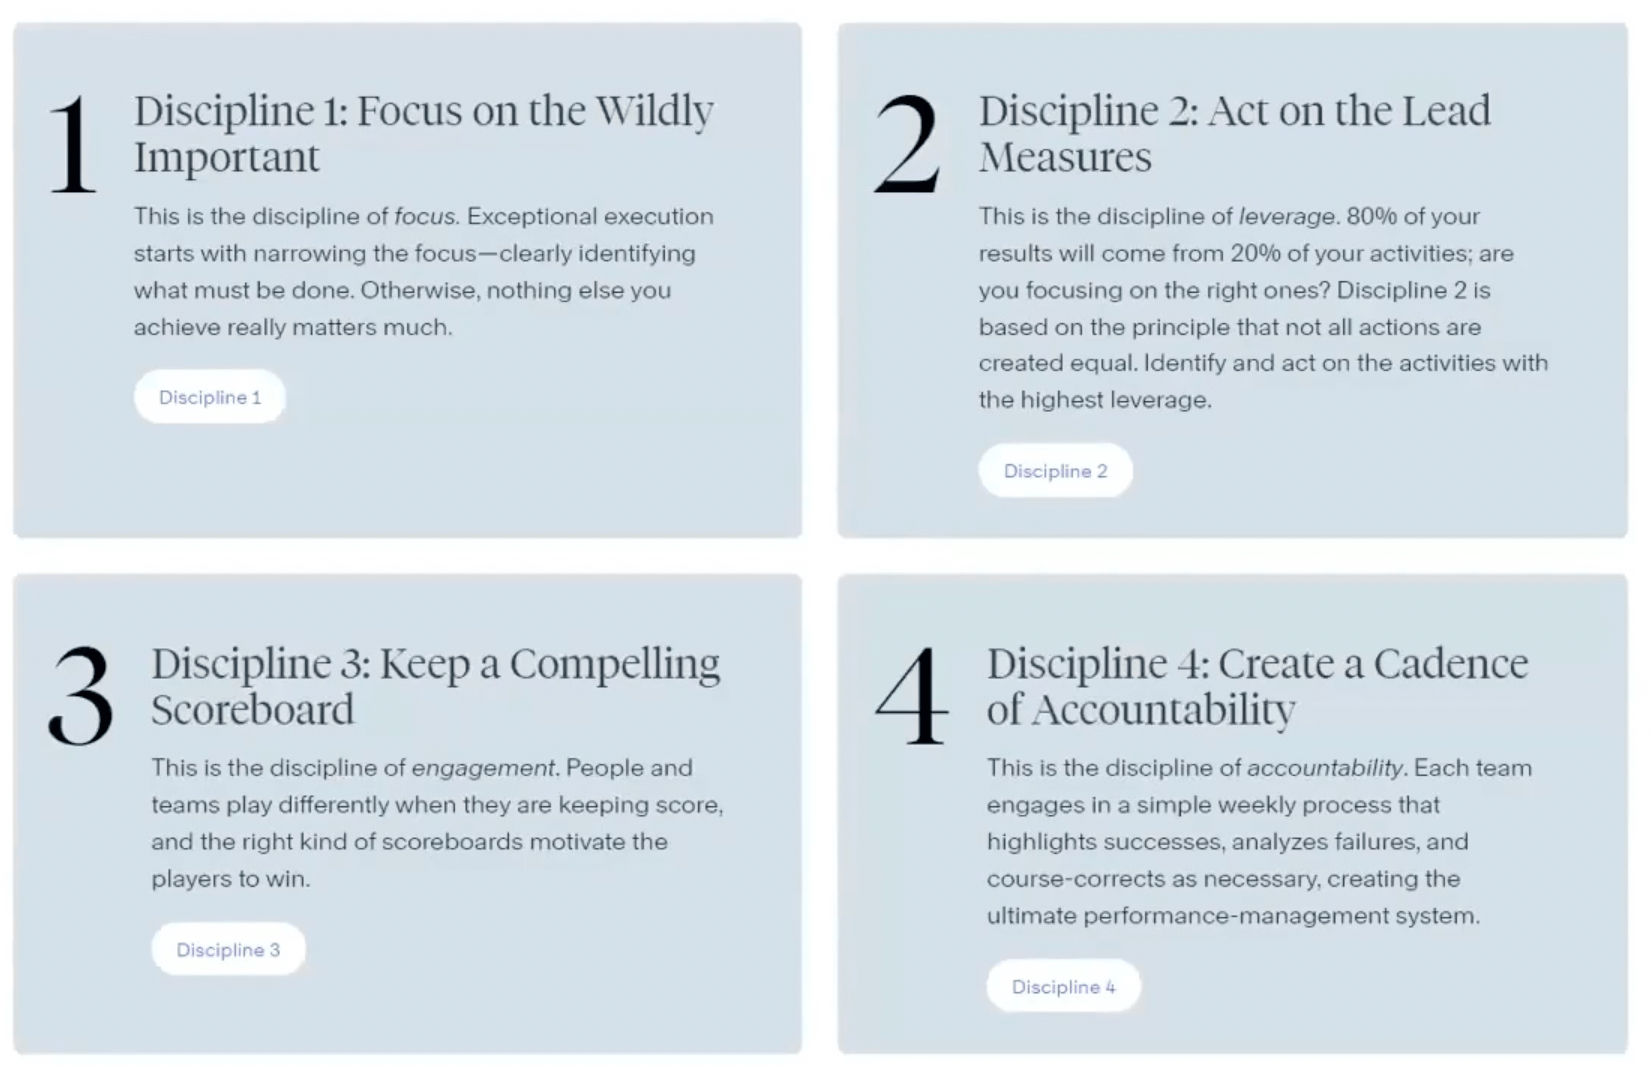
Another popular and effective execution tool is called ‘4DX’, or ‘the 4 Disciplines of Execution.’ It comes from FranklinCovey, in a book by Chris McChesney.
The first discipline teaches us to ‘focus on the wildly important.’ In other words, how will we exceed and what’s most important right now?
Discipline two is to ‘act on the lead measures.’ If you read this book or take the course, you’ll hear about the differences between lead and lag measures. Lag measures are the results that we want but often can't act on directly. Lead measures are the things we can act on and measure that’ll in turn act on the lag measures.
In driver-based forecasting, the drivers are lead measures.
Again, this tool helps you to identify the ‘what’ and the ‘how.’
Objectives and key results (OKRs)
Some people think about lead measures as KPIs, but when we’re translating strategy to initiatives, they're more like OKRs.
There's a difference between KPIs and OKRs. You can think of KPIs as indicators about your business as usual, and OKRs as measures of how strategic initiatives are going.
The concept of OKRs was developed by Andy Grove at Intel, and brought to Google by Intel employee turned venture capitalist, John Doerr. John explains the concept in some detail in his book, ‘Measure What Matters.’
Objectives describe what needs to be done differently. Key results are the things that need to happen in the near term to make the objective come true. Do you see the similarity to the 4 Disciplines of Execution?
The objectives are the lag measures, what we want to have happen. They’re the ‘what.’ Key results are the actions we plan to take to act on the lead measure, and the specific impact on the lead measure we hope to have. It's the ‘how.’
It's another tool to translate strategy into actions.
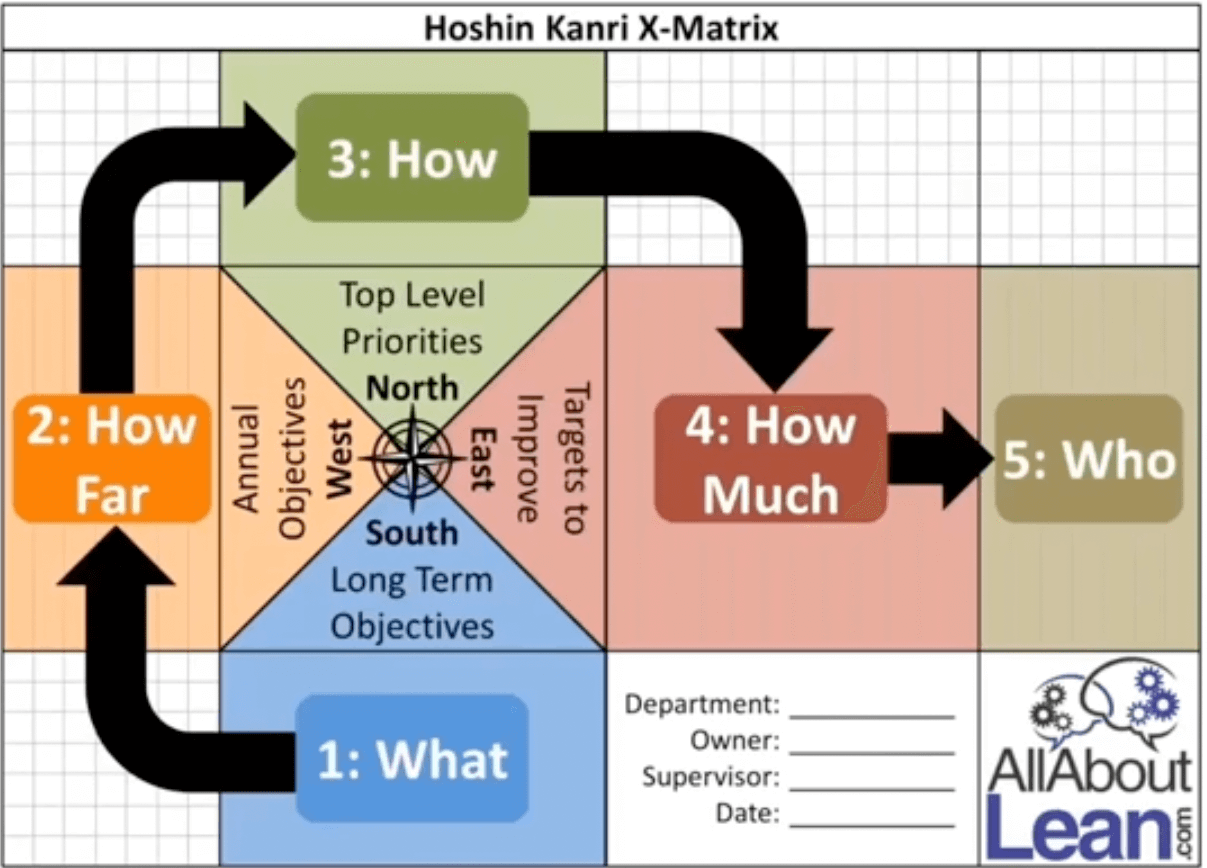
Hoshin Kanri
Hoshin Kanri is the lean version of strategic initiative deployment. You’ll see the concepts of ‘what’ and ‘how’ as three to five-year breakthrough objectives get broken down into initiatives with clear results and target metrics.
If your company is using one of these four tools or something similar, you can supercharge the effort with a good driver-based forecast and bring finance and financial results to the center of strategic planning.
On the other hand, if your company doesn’t have a good tool for translating strategy into action, then you might be the one to introduce one of these tools.
What is driver-based forecasting and why is it important?
When I talk about driver-based forecasting, I'm talking about the Beyond Budgeting movement. It's been around for a long time and is clearly superior to annual budgeting.
However, the torturous annual budgeting process is so ingrained in the way boards control companies, CEOs control management teams, and the way bonuses work, that it’s alive and well in somewhere between 75% and 90% of companies. So it's no surprise if your company still does an annual budget.
I’ve found that the best way to get rid of the budget is to make it irrelevant. The best way to do that is to have a good five-year driver-based rolling forecast that connects the strategies to the initiatives necessary to achieve the results we want.
In other words, it's often easiest to add a DBF to what you’re currently doing. Maybe introduce it in the middle of the year, extend the visibility well past year-end, start to use the next year's forecast as a base for your annual planning process, and then eventually drop the budget and all the problems that go with it.
Let me try to convince you why the driver-based forecast is the most important financial tool a company can have.
Let's start with what a forecast isn’t:
It's not a prediction, since the purpose of business forecasting is not to foretell the future, but to change it.
It's not a commitment, since forecasts need to change to reflect the changes in the environment.
It's not precise, because it's neither possible nor necessary.
How does this differ from an annual budget? Companies often act like a budget is a contract between management and the board, a CEO and the department head, or a department head and a manager. You agree to spend less than this budget, and if everyone hits their department budget, then it’ll add up to meeting the company budget, and we'll get the bonus the board agreed to.
The etymology of the word ‘budget’ shows it came from the word for leather bag, purse, or wallet. Managers tend to feel like they've been given a bag of money and they can spend it how they like. If they don't spend more or ask for more, they probably won't have to discuss how they spent it at all. But an agile organization must adjust its spending plans as it starts to see the results of its initiatives.
The purpose of a budget is to control spending. The purpose of a driver-based forecast, on the other hand, is to enable the creation of grounded and connected strategic and financial plans.
To be useful, it doesn't need to be detailed down to the GL account, it just needs to indicate what's driving future performance and how our initiatives are going. We need to identify and track the right drivers.
Once you identify the drivers of your financial performance, you can think of the recent trends of those drivers like balls flying through space. They have a trajectory and a velocity. They may be accelerating or decelerating. Based on the past, we can project their path into the future.
If we add up the financial results of the drivers continuing on their current course and speed, we can see what our results will look like if we allow these drivers to continue as they are. If we don't like the result, we have to apply a force to it and nudge that driver to change its course.
NASA's DART mission involved sending a spacecraft out to collide with an asteroid to nudge it into a different orbit. That's what our strategic initiatives do. They’re intentional actions that companies take to nudge a key driver in a different direction or change its speed or acceleration.
Only the finance team can provide the tools to illuminate how big a nudge it’ll take to achieve a certain result or to break down the effort into the lead measures that’ll produce the desired lag measure. Talking about which department, which account, or in which period of variance the budget occurred won’t help the company achieve its strategy.

Applying driver-based forecasting to a real-world example
Imagine that you start your own strategic consulting company and you're desperate for your first client. Finally, you get to lean on a small company with an ambitious leader who hopes to quadruple revenue next year. The leader in this case is your 10-year-old niece, Susie, and the business is her lemonade stand. Well, you have to start somewhere.
Let’s first identify the revenue drivers.
Revenue drivers
Revenue can always first be broken down by price and quantity.
Susie gets to set the price on her lemonade stand, and we just have to keep an eye on the elasticity of demand and see if changing the price causes us to lose customers.
Let's talk about quantity drivers, and think about which of them we could try to nudge with a strategic initiative, and which we might need to keep an eye on from a risk management perspective:
- Passers-by per hour - we can’t control how busy the street corner is, but we may need to track how it's trending and plan corrective actions or responses.
- Hours open per day - we can control this, but additional hours could be less productive.
- Days open per week - we could have an initiative to change this.
- Weeks open per year - we can control this.
- The percent that stop and consider buying - we need to consider all the factors that impact this driver. They include our signage, how cute Susie and her stand look, the weather and how hot it is, how busy the people are, etc. We don't control all of these factors, but we can certainly control signage and staff.
- The percent of those that buy -this may be impacted by Susie’s sales skills, whether she can make change for a 20, whether Susie takes Apple Pay or Venmo, or if her price is too high, etc.
We start by building our driver-based forecast with the actual results of last year, broken down by driver.
Susie tells us that she gets on average 80 passers-by per hour. She's open from 10 am to 2 pm, which is four hours per day. She's open every Saturday except Christmas and New Year, so that's one day a week and 50 weeks a year.
This year, Susie had one out of every four passers-by stop and consider buying a cup, and she converted 90% of those to customers. So doing the math in our driver-based forecast model, we get 3,600 cups sold at $1.25 per cup for a total of $4,500 in revenue.
But remember, Susie has hired you to quadruple revenue. What will you advise her? What are the levers she can pull? What strategic initiatives could we implement for her lemonade stand to grow revenue?
Strategic initiatives
On the price side, we can suggest she raise the price from $1.25 to $1.50.
With respect to the quantity drivers, we consider trying to impact the number of passers-by per hour but decide we aren't willing to change the street corner and there isn't much else we can do. But Susie could increase the hours per day from four to six. She's going to be open from 9 am to 3 pm. She can also add Sundays and update her sign to say, ‘open every weekend.’
She should stick to 50 hours per year because 10-year-olds need their winter break.
We recommend improving signs and messaging, and she can place some signs down the street.
She was converting 90% of buyers so there isn't much to do there, but our price increase may cause her to lose some here so we'll watch our elasticity of demand.
Now, let's update our driver-based forecast for next year and see if our strategic plan would lead to the result we're looking for.
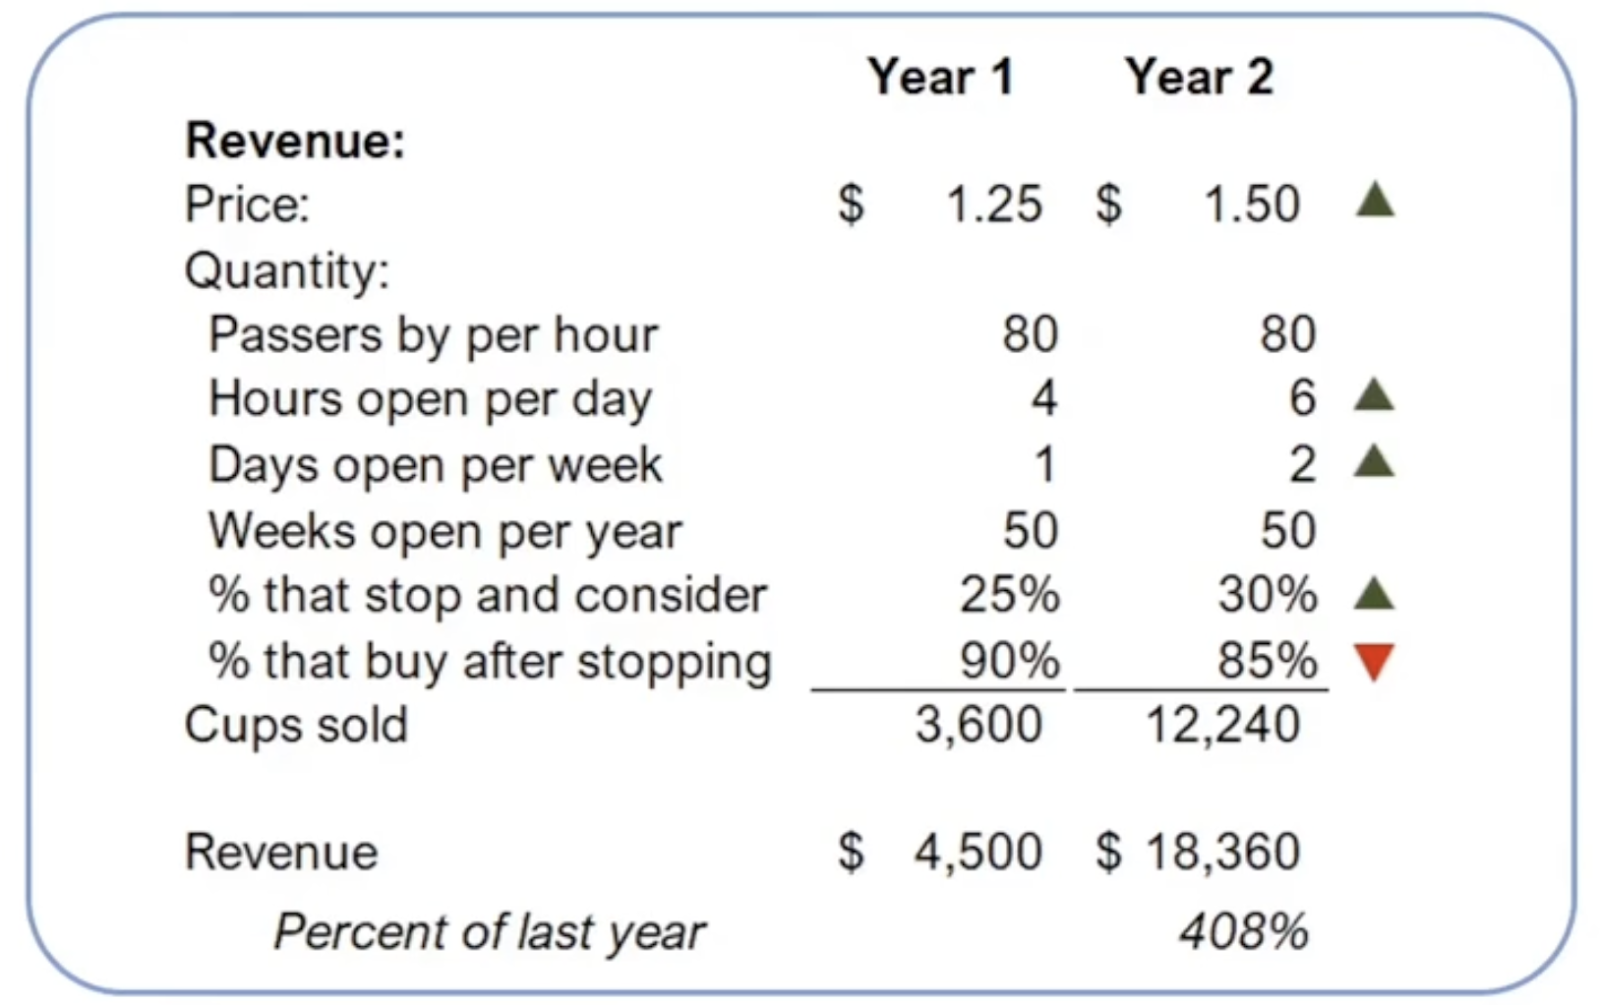
Our price is up, passers-by per hour is flat, hours open per day is up from four to six, days open per week is up from one to two, and weeks open per year is flat. We expect our signs and improved outreach to increase the percentage that stop and consider buying from 25% to 30%, and we expect to lose a little on the percentage that buy after stopping from 90% to 85%, due to our price increase.
So our driver-based forecast for next year will give us 12,240 cups sold at $1.50. And if we execute on these initiatives, we’ll achieve our goal to quadruple revenue to $18,360. We've clearly broken down our strategic objective so we can see the ‘how.’
Now, as the year unfolds, what do we want to keep an eye on? We know we can control our hours per day and the days per week, but we don't have experience with the nine o'clock hour or the two o'clock hour, and we don't have experience on Sundays.
Maybe the passers-by per hour will be lower on average. Maybe our improved signs won't be enough to get 30% to stop and consider. Maybe we won't convert 85%.
We know we have initiatives to act on the lead indicators, but we'll need to adapt as the year goes on and we'll need to be able to measure these lead indicators throughout the year.
If the passers-by per hour falls, we'll need some countermeasures. To get the desired result, we may need a new initiative to get a higher percentage to stop and maybe more signs. But what if we already exhausted our sign budget?
In many companies, the budget could limit our response. Marketing doesn't want to be over budget, even though sales are behind in the revenue quota. But here, the driver-based forecast is our primary financial tool for running the business. We can be agile and we can talk about what to do given what's happening with our drivers.

Changing the conversations your company is having about financial results
I was once leading an FP&A transformation and met with the team and asked them to imagine they could sit up in a gallery above the management team of a more successful company as they talked about their financial results.
I asked them, “How do you think their discussion would differ from your company’s?” They said that the conversation would be forward-looking, not focused on the past, and it would be action-oriented. They’d understand what was happening in the business, where it was headed, and who needed to do what to succeed.
That's what a good driver-based forecast does. The conversation changes to be more forward-looking and action-oriented. We can talk about how the strategic initiatives have done. What’s the latest outlook for our drivers? How has our forecast changed? What corrective actions are possible? And importantly, can we do more?
Now, let's talk about how we change the conversation when revenue unexpectedly starts to drop. It often leads to layoffs.
Top mistakes companies make with layoffs
Reacting too late
The first thing they notice is that the Year to Date budget is behind plan. But most companies don't have a good measure of the drivers that were going to get us to plan in the first place, so they ask the Head of Sales whether they think they can make it up by the end of the year.
“I think so,” they may say. Since the plan was based on hope and they still have hope, they may think they can still hit plan, but it often takes another quarter to realize that they won't.
Reacting to the decline in revenue with an equivalent decline in expenses
The conversation usually goes, “Revenues are going to be down 20%, so we need to cut expenses by 20%. Payroll is 70% of our cost and an even higher percentage of the cost we can control quickly, so we'll need to cut heads by 30%.”
This brings us to the next mistake:
Not remembering the role people play in driving revenue and adding value
The reason any of us are hired is because there’s a job to be done that contributes to the company's delivery to customers, directly or indirectly, or to the creation of new value.
So across the board, cuts impact revenue drivers in chaotic and unknown ways that sometimes lead to a death spiral because they cause a further drop in revenue that’s followed by a further cut in heads.
Not diagnosing the cause of the decrease in revenue
Think about how the driver-based forecast we did for Susie's lemonade stand changes the conversation about a revenue drop. We’d ask, “Are there fewer people passing by? On which day? At which hours? Or is it because nobody’s stopping to consider buying? Or is there some reason the percentage of people buying has fallen substantially?”
These questions help us create a new plan for success over our five-year forecast horizon.
Focusing on the fiscal year and still trying to get back to plan
If something unexpected has happened to fundamentally shake revenue, we need to adjust our strategy and our long-term plan. Whatever we do to try to fix the current year is probably at odds with what's most important for the business.
For example, one company I was at put lots of effort and activity into pulling revenue from January and February into November and December. Good for the current year, but not so good for the next, and it does nothing to address the fundamental revenue issue.
Sometimes the situation calls for headcount reductions, but I feel a lot better about it when we've understood what's happening and the layoff is part of a new plan for success.
In my experience, a good five-year driver-based rolling forecast not only helps to navigate a crisis better and enable more effective layoffs, but also prevents layoffs in the first place. This is because I can see past the end of the year, I'm monitoring lead indicators, my risk management plan is based on the drivers I can't control, and I can be more agile in reacting to a change in one driver.


Become an FA Insider
Thank you for subscribing
Get exclusive insights, frameworks, and strategies from finance leaders driving real business impact.
An email has been successfully sent to confirm your subscription.
 Follow us on LinkedIn