Not sure where to start with cost-benefit analysis (CBA)?
We hear you.
With so many complex factors to identify and monetize, it can be hard to know which costs and benefits to focus on first, or how to accurately quantify them.

If you want to learn more about what cost-benefit analysis is and how to do it, keep reading as we dive into five key steps to streamline your financial evaluations and drive smarter decisions.
What is meant by cost-benefit analysis?
Cost-benefit analysis attempts to lay out an objective framework for any major spending or investment choice by asking two vital questions:
1. Do the expected benefits outweigh the expected costs over time?
2. And if so, by how much relative to other alternatives?
It provides the needed structure for breaking down decisions into defined costs and benefits that can be systematically assessed.

What is the main goal of using a cost-benefit analysis? 🎯
The main goal of doing a cost-benefit analysis is to determine whether the benefits of a potential project or decision outweigh the costs.
Put simply, it answers the question: is this project or task worth it?
To get that answer, you've got to weigh all the possible outcomes, which involves lining up the good, the bad, and everything in between.
And yes, that means you need to sift through the options and choose the one that brings the most value without weighing you down with excessive costs.

Pros and cons of cost-benefit analysis (and when to use it)
Cost-benefit analysis offers a structured approach to decision-making, but it carries limitations that deserve honest acknowledgment.
Understanding both sides helps you apply the method where it adds value and recognize when alternative approaches may serve you better.
Advantages
CBA creates a common framework for comparing options that might otherwise seem incommensurable.
By translating diverse factors into monetary terms, it enables apples-to-apples comparisons across projects, departments, or strategic initiatives. This comparability supports prioritization when resources are limited.
The process itself imposes discipline. Listing costs and benefits forces teams to surface assumptions, identify data gaps, and confront trade-offs that might otherwise remain implicit.
Transparency improves when stakeholders can see the reasoning behind a recommendation rather than accepting conclusions on faith.
CBA also facilitates alignment. When finance, operations, and strategy teams work from the same analysis, disagreements shift from competing intuitions to specific assumptions that can be tested and debated.
This shared foundation often accelerates decision-making and reduces post-decision second-guessing.
Disadvantages
Intangible valuation introduces uncertainty that the final numbers may obscure. Assigning a dollar figure to brand reputation or employee morale requires assumptions that reasonable people can dispute.
As David Magnan, a healthcare data analytics expert, observes about hidden inefficiencies: "Twenty to thirty percent of the transactions executed in health care are unnecessary, and you're paying for them."
This insight highlights how bias and misaligned incentives can distort the data feeding any analysis.
Double-counting poses a persistent risk. A benefit captured in one line item (say, productivity gains) may reappear indirectly in another, inflating the total. Careful documentation and cross-checking help, but the risk never disappears entirely.
CBA can also create false precision. A net benefit figure of $127,432 suggests accuracy that the underlying estimates may not support. Sensitivity analysis mitigates this concern, but readers must remember that outputs are only as reliable as inputs.
Finally, CBA demands time and effort. For small decisions or situations where speed matters more than precision, a lighter-weight approach may be more appropriate.

When to use CBA and when to consider alternatives
CBA works best for decisions with measurable financial consequences, multiple alternatives, and stakeholders who need transparent justification.
It suits capital investments, process changes, and strategic initiatives where trade-offs can be quantified.
Consider alternatives when outcomes resist monetization (ethical decisions, compliance requirements), when speed outweighs precision, or when distributional impacts matter more than aggregate net benefit.
In those cases, multi-criteria analysis, scenario planning, or stakeholder deliberation may complement or replace CBA.
To mitigate common downsides, maintain an assumption log, run sensitivity tests on key variables, and invite stakeholder review before finalizing recommendations.
These practices keep the analysis credible without pretending to certainty it cannot deliver.
Key components of a cost-benefit analysis (what to include)
A complete cost-benefit analysis contains several interconnected components that move from framing the decision to delivering a recommendation.
Understanding these components helps you build an analysis that stakeholders can follow, challenge, and ultimately trust.
Decision objective
State the question you are trying to answer. Are you evaluating whether to proceed with a single project, or comparing multiple alternatives? Clarity here prevents scope creep and keeps the analysis focused.

Alternatives under consideration
List the options you will compare, including the status quo or "do nothing" baseline. Every alternative should be mutually exclusive and collectively exhaustive within the decision context.
Time horizon
Define the period over which you will measure costs and benefits. A three-year horizon suits many operational decisions, while infrastructure investments may require ten years or more.
The horizon should reflect when meaningful costs and benefits occur.
Assumptions and data sources
Document where your numbers come from and what you assume about future conditions.
As David Magnan notes about cost visibility: "As finance people, one of the key things to managing any cost is to know what it is." Reliable unit-cost data and transparent assumptions form the foundation of credible analysis.

Cost categories
Include direct costs (materials, labor, equipment), indirect costs (overhead, maintenance, depreciation), intangible costs (reputational risk, morale impact), and opportunity costs (value of foregone alternatives).
Each category should have a clear measurement approach.
Benefit categories
Capture tangible benefits (revenue gains, cost savings, productivity improvements) and intangible benefits (customer satisfaction, employee retention, brand value).
Where possible, link intangibles to measurable proxies.
Decision metrics
Calculate net benefit (total benefits minus total costs) and the benefit-cost ratio (total benefits divided by total costs).
These metrics appear in Step 4 of the process and form the quantitative basis for your recommendation.
Risk testing and sensitivity analysis
Identify the assumptions most likely to change and test how variations affect your results. This step, covered in Step 4, reveals which estimates matter most and how robust your conclusions are.
Think of these components as falling into two groups: inputs (assumptions, forecasts, data sources) and outputs (net benefit, BCR, recommendation).
The inputs feed the calculations; the outputs inform the decision. A junior analyst can use this checklist to ensure nothing critical is missing before presenting findings to leadership.

How do you calculate cost and benefit analysis?
A cost-benefit analysis balances the cost of an action against its potential benefits, providing a clear financial comparison to guide decision-making.
To calculate cost and benefit analysis, there are several steps you must follow (see below). However, in terms of metrics, the most critical aspect is accurately quantifying and then comparing the total costs against the total benefits.
Here’s how you can do it (we'll get into the steps of the cost-benefit analysis process in more detail in the next section):
- Quantify costs: First, list all the costs associated with the project or decision and assign a monetary value to each one.
- Quantify benefits: Similarly, identify all potential benefits (both tangible and intangible). Again, assign a monetary value to each benefit.
- Total the costs and benefits: Add up all the quantified costs to get a total cost figure. Do the same for the benefits to get a total benefits figure.
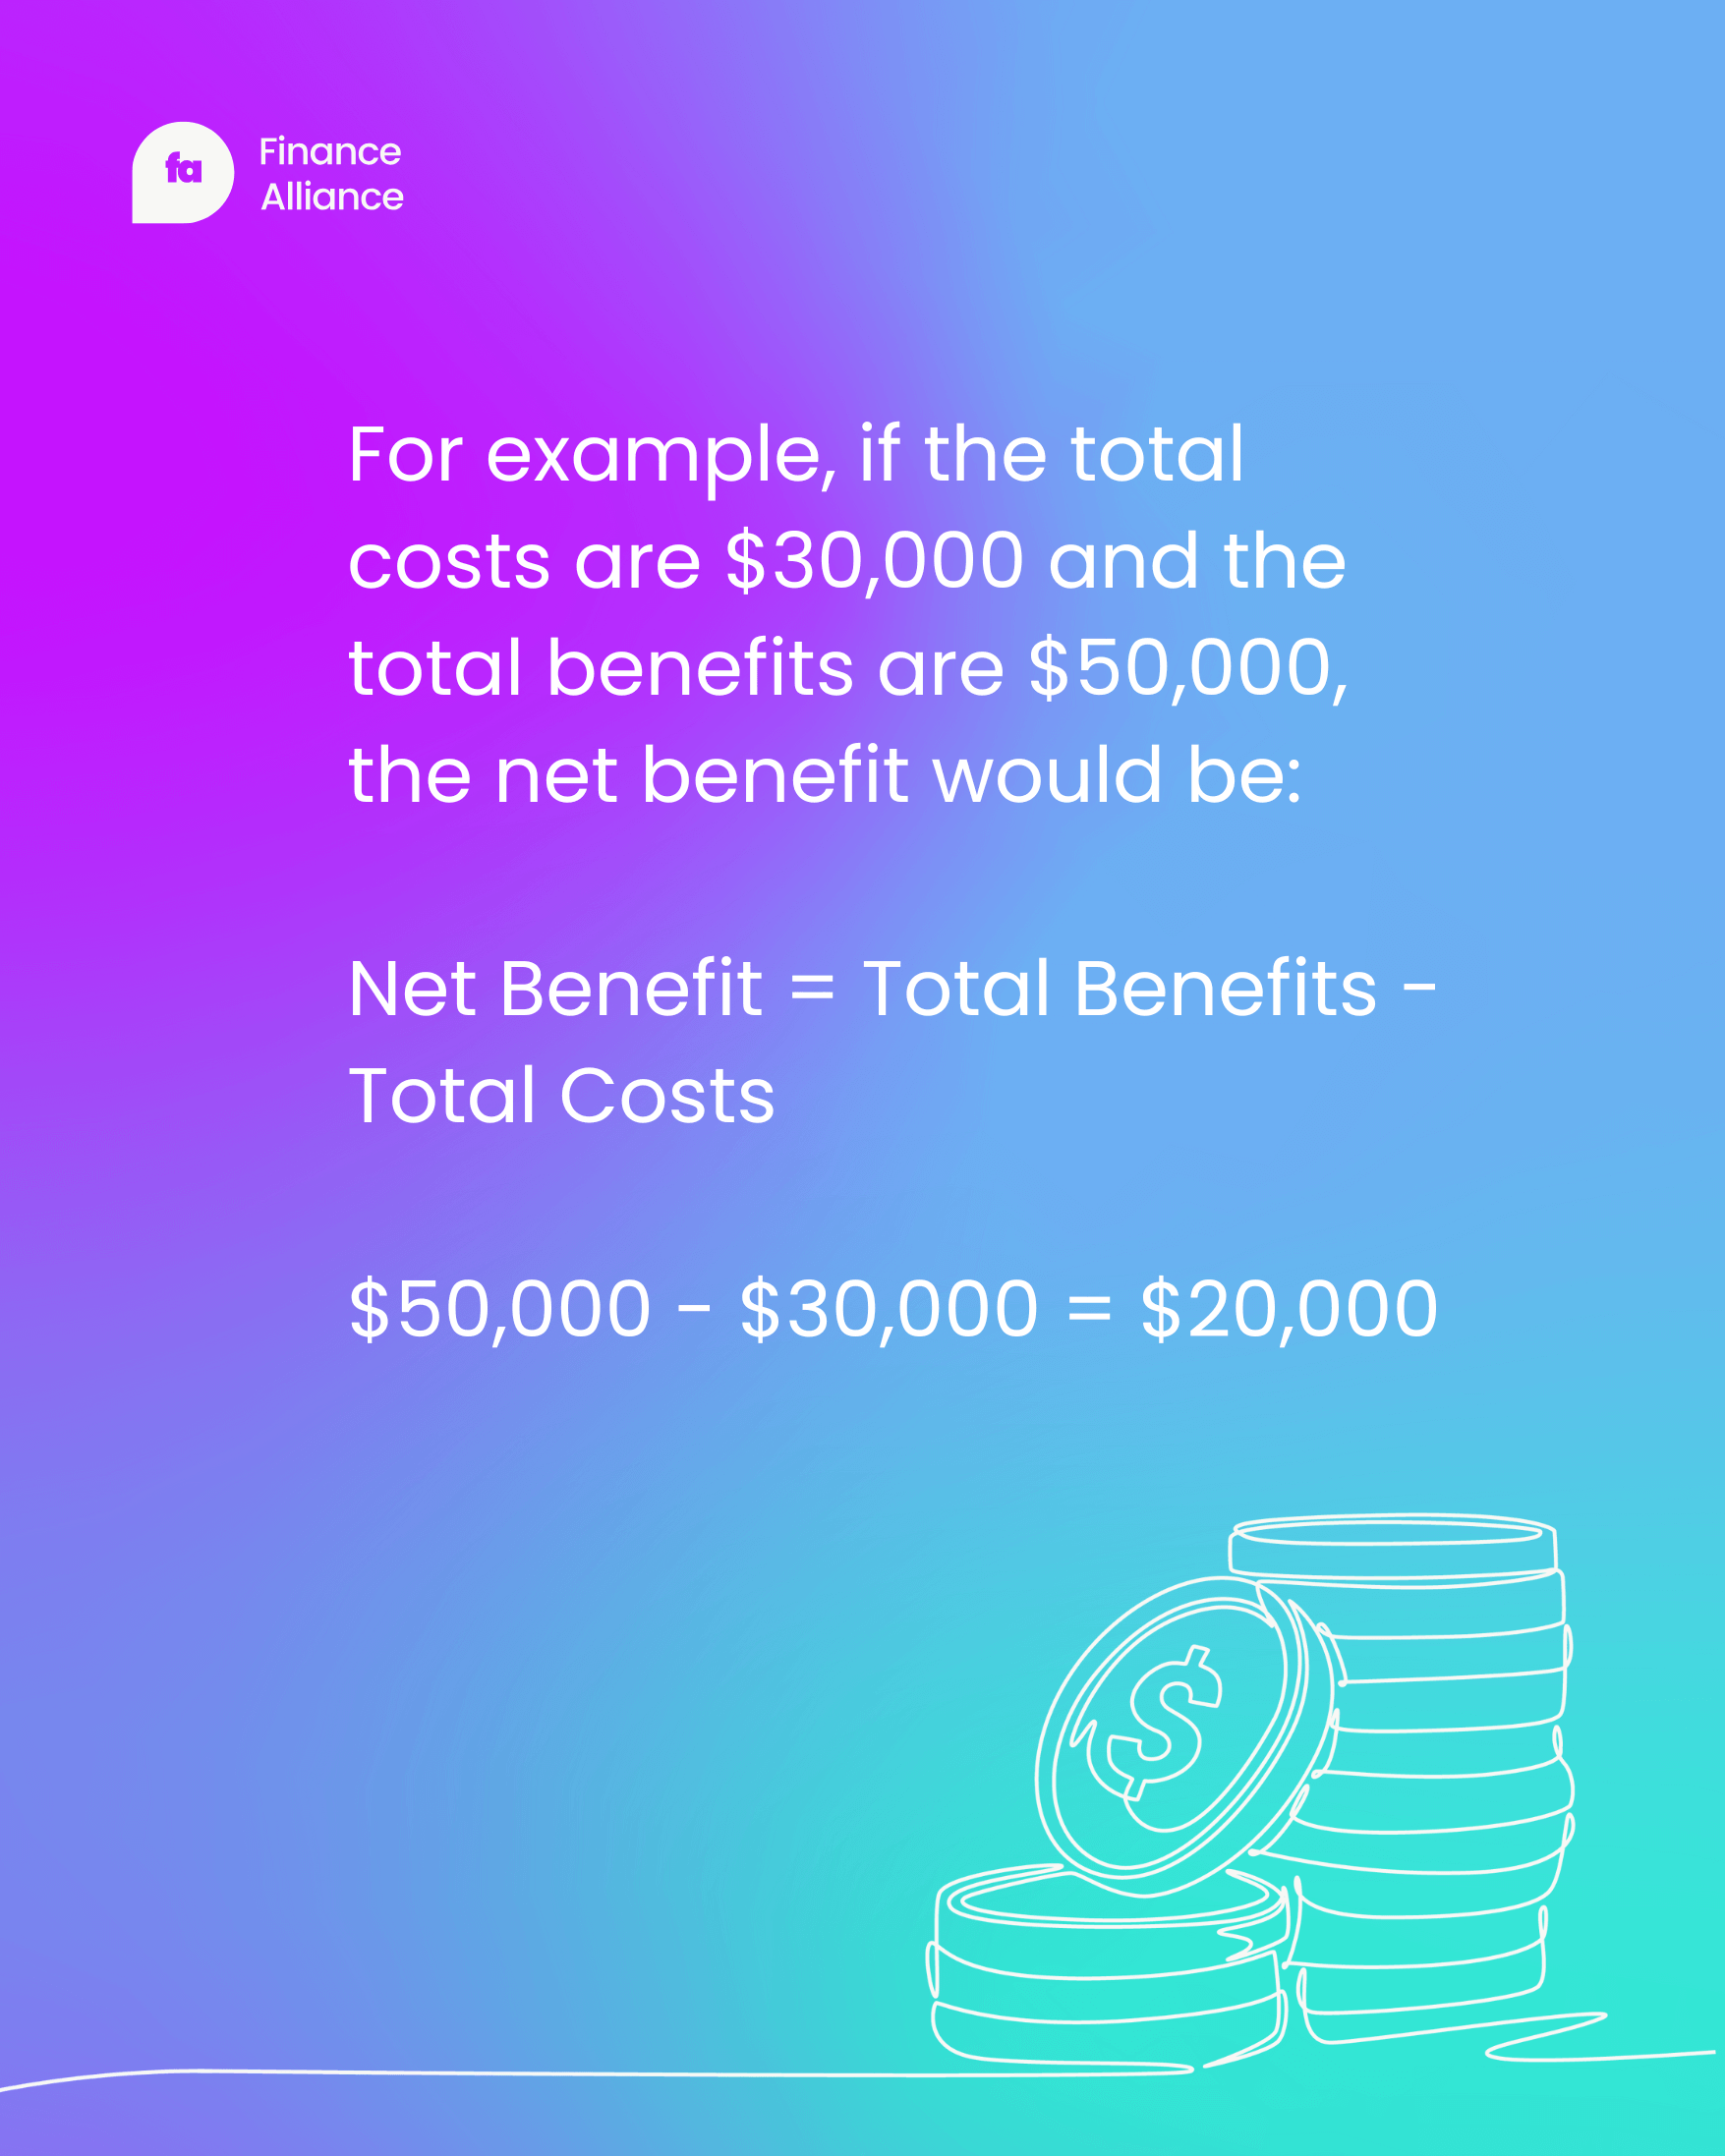
- Calculate net benefits: Subtract the total costs from the total benefits. This calculation will give you the net benefit (or net cost, if the costs exceed the benefits) of the project or decision.
- Additional analysis: To deepen the analysis, you might consider metrics like the benefit-cost ratio (BCR). To calculate this, you must divide the total benefits of a project by its total costs.
The formula looks something like this:
BCR = Total Benefits / Total Costs
BCR worked example (with interpretation)
The BCR expresses the relationship between what you gain and what you spend in a single, comparable figure.
It answers a straightforward question: for every dollar of cost, how many dollars of benefit do you receive?
A BCR of 1.5 means each dollar invested returns $1.50 in benefits, leaving you with a net gain of fifty cents per dollar.
The formula itself is simple: BCR equals Total Benefits divided by Total Costs. Both figures must share the same time horizon and scope. If your benefits span five years, your costs should too.
If you discount future cash flows to present value for benefits, apply the same discount rate to costs. Consistency here prevents misleading comparisons.
Consider a practical example. A company evaluates a process automation project with the following estimates:
- Total costs (implementation, training, maintenance over 3 years): $100,000
- Total benefits (labor savings, error reduction, faster cycle times over 3 years): $150,000
- Net benefit: $50,000
- BCR: 1.5

Interpreting this result involves three decision rules.
A BCR greater than 1.0 indicates benefits exceed costs, making the project financially viable on its own terms.
A BCR equal to 1.0 means you break even; neither gaining nor losing.
A BCR below 1.0 signals that costs outweigh benefits, suggesting reconsideration or redesign.
When comparing multiple options, BCR helps you rank them by efficiency. A project with a BCR of 2.0 delivers more benefit per dollar than one with a BCR of 1.3, assuming similar risk profiles and strategic alignment.
This ranking function makes BCR especially useful when capital is constrained and you must choose among competing proposals.
A few caveats deserve attention. BCR does not reveal absolute dollar amounts; a project with a BCR of 3.0 and $30,000 in net benefit may matter less than one with a BCR of 1.2 and $500,000 in net benefit.
The ratio is also sensitive to assumptions; small changes in cost or benefit estimates can shift the BCR meaningfully, so sensitivity analysis remains important.
Finally, avoid double-counting benefits that already appear in another metric or line item.
For projects with significant timing differences in cash flows (where benefits arrive late or costs cluster early) Net Present Value (NPV) often provides a more nuanced picture than BCR alone.
NPV accounts for the time value of money explicitly, making it a useful complement when multi-year timing matters.
So, what is a good cost-benefit ratio?
A BCR greater than 1.0 indicates that the project's benefits exceed its costs, suggesting it's a financially viable option. On the other hand, a BCR less than 1.0 means the costs outweigh the benefits, signaling a potential reconsideration of the project.
5 steps of the cost-benefit analysis process
Quick-start checklist: What you need before you begin
Before diving into the five steps, gather the inputs and assign the responsibilities that will keep your analysis on track.
This checklist mirrors the process ahead and ensures you have a concrete deliverable at each stage.
1. Scope statement
Define the decision you are evaluating, the alternatives under consideration, and the time horizon for costs and benefits.
Assign ownership to a project manager or finance lead who will maintain the analysis document.
Required inputs include strategic objectives, stakeholder priorities, and any constraints (budget caps, regulatory requirements, or timeline limits).
2. Cost and benefit inventory
List every cost and benefit category relevant to each alternative.
Assign department heads or subject matter experts to contribute line items from their areas; operations for labor and materials, marketing for customer acquisition costs, HR for turnover-related expenses.
Required inputs include historical spending data, vendor quotes, and revenue forecasts.
3. Assumption log
Document the sources, methods, and confidence levels behind each monetary estimate. This log becomes your audit trail and sensitivity testing reference.
Assign a finance analyst to maintain version control and flag estimates that rely on weak data.
4. Summary comparison table
Calculate net benefit and BCR for each alternative. Present the results in a side-by-side table that includes total costs, total benefits, net benefit, and BCR.
Assign the finance lead to validate calculations and ensure consistency across alternatives.
5. Recommendation memo. Synthesize the quantitative findings with qualitative considerations (strategic fit, risk factors, stakeholder impact) into a one-page recommendation.
Assign the project sponsor to review and approve before presenting to decision-makers.

What your final output should look like
A complete cost-benefit analysis package includes the scope statement, the cost and benefit inventory with supporting data, the assumption log, the summary comparison table, and the recommendation memo.
Each document should reference the others so reviewers can trace any figure back to its source.
The package should answer three questions clearly: Which alternative delivers the highest net benefit? How confident are we in the estimates? What non-financial factors should influence the final decision?
When these elements come together, you have a decision-ready analysis that stakeholders can trust and act upon.
Not every approach to cost-benefit analysis will be the same. But there tends to be five vital steps (or variations of these steps) that most will follow when carrying out the analysis.
These steps are:
Now, let’s explore each step in more detail:
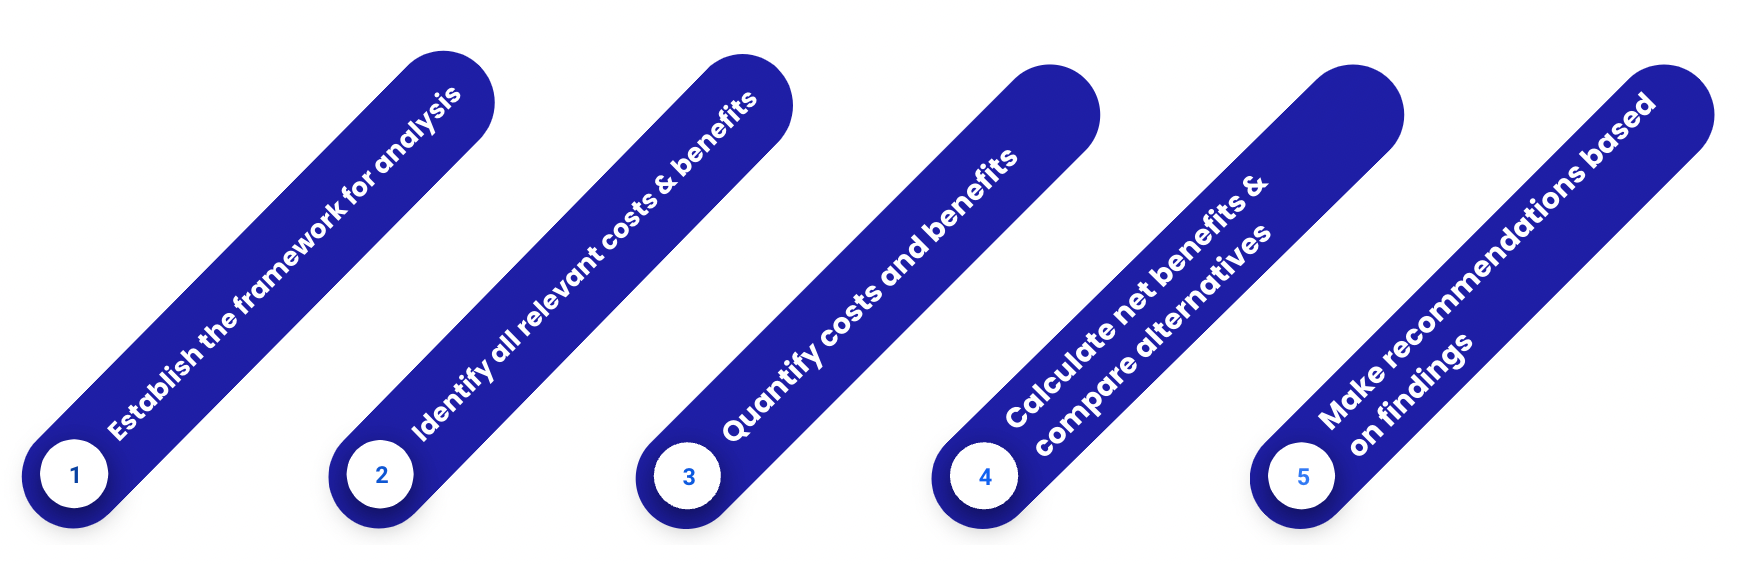
1. Establish the framework for analysis
Kick things off by setting clear objectives and defining the scope of your analysis. This sets the stage for everything that follows, ensuring you're working within a structured and focused context.
Most of the planning takes place during this stage and there’s some questions you need answers to, such as:
What’s the purpose of the cost-benefit analysis?
For example, is it to help determine whether your company should move forward with a new software development project?
Or perhaps you want to assess the feasibility of the company's expansion into a new market, weighing the potential increase in customer base and revenue against the marketing and operational setup costs.
Whatever the case, zone in on the main purpose of the cost-benefit analysis to help maintain focus throughout the process.
What's the timeline?
Your timeline is important. A short-term cost-benefit analysis could involve assessing the financial impact of running a promotional campaign over the course of three months, while a long-term analysis might look at the benefits and costs of a major infrastructure project planned to unfold over the next 10 years.
Decide on your timeline as early in the process as possible.
It's important to set both your goals and objectives at this stage too. Having a clear goal in mind will help during the next step. You’ll also need to choose how you’ll measure and compare costs and benefits and what metric you’ll use.
2. Identify all relevant costs and benefits
Now, list out all the potential costs; think materials, labor, time, and benefits, like increased revenue, efficiency gains, or intangible perks. This step is crucial; missing something here can skew your entire analysis.
And while you’re busy listing out all of those potential costs, don’t forget to consider the benefits too.
These could be tangible, like increased revenue and efficiency gains, or intangible, like enhanced brand reputation or employee satisfaction.
Costs (and benefits) typically include:
Direct costs:
- Materials and supplies needed for a project.
- Labor costs, including salaries, wages, and benefits for employees directly involved.
- Equipment costs, whether it's purchasing or leasing necessary machinery.
Possible benefits:
- Increased revenue from sales growth, new customers, or market expansion.
- Enhanced productivity, leading to more output with the same or fewer inputs.
Indirect costs:
- Overhead expenses like utilities, rent for facilities, and administrative staff salaries.
- Maintenance and operational costs that keep the project running.
- Depreciation of equipment and technology used in the project.
Possible benefits:
- Long-term savings from improved processes or technology upgrades.
- Boosted brand value and stronger market positioning that can lead to indirect revenue growth.

Intangible costs:
- Negative impact on brand reputation or employee morale.
- Potential loss of customer loyalty or market share.
Possible benefits:
- Customer satisfaction that could translate into loyalty and word-of-mouth marketing.
- Improved employee well-being and job satisfaction, potentially leading to higher retention rates.
Opportunity costs:
- Potential revenue lost by choosing one project over another.
- The value of alternative uses of time and resources that are diverted from other activities.
Possible benefits:
- The project selected may offer a strategic advantage.
- Allocating time and resources to the chosen initiative could streamline operations or improve product quality.
- The decision might open up avenues for partnerships, collaborations, or even acquisitions.

3. Quantify costs and benefits
Assign a monetary value to each cost and benefit you've listed. This might require some digging into market rates, historical data, or expert forecasts, but it's worth the effort to get the most accurate picture possible.
By quantifying the financial elements of your cost-benefit analysis, you'll lay the groundwork for making decisions that are both financially sound and strategically smart.
Remember, consistency is key when you're crunching the numbers; make sure you're using the same currency and time frame across all elements for a coherent analysis.
How to quantify intangible costs and benefits (practical methods)
Intangible costs and benefits often carry significant weight in decision-making, yet they resist easy measurement.
Brand reputation, employee morale, customer satisfaction, and risk reduction all influence outcomes in ways that matter deeply to stakeholders.
The challenge lies in translating these factors into defensible monetary estimates without overstating precision or burying important considerations under arbitrary numbers.
Several practical valuation techniques can help you move from vague acknowledgment to structured estimation.
The avoided cost method asks what expenses you would incur if the intangible benefit disappeared; for example, calculating the recruitment and training costs you sidestep when employee retention improves.
The replacement cost approach estimates what it would take to recreate a lost asset, such as rebuilding brand awareness through paid campaigns after reputational damage.
Willingness-to-pay surveys gauge how much customers or stakeholders would spend to obtain a benefit, while productivity and time value methods convert efficiency gains into labor cost equivalents.
Risk-weighted expected value multiplies the probability of an adverse event by its financial impact, giving you a dollar figure for risk reduction.
Proxy metrics tie intangibles to measurable outcomes, linking customer satisfaction scores to retention rates, then to lifetime customer value.
As David Magnan observes about employee engagement and cost visibility: "If I could see who's charging what, my co pay would be lower... There's more things you can do if you saw what was going on."
This insight applies broadly; transparency around intangible drivers enables behavioral changes and incentives that translate into measurable savings.
A few guardrails keep your estimates credible. Document every assumption so reviewers can challenge or adjust them. Avoid double counting by ensuring an intangible benefit captured in one line item does not reappear elsewhere.
Align time horizons so that a five-year brand benefit is not compared against a one-year cost. And separate quantified impacts from qualitative ones in your summary table.
Consider a worked example: reduced employee turnover. If your annual turnover rate drops from 15% to 10% on a 200-person team, you retain 10 additional employees per year.
If each departure costs $12,000 in recruiting, onboarding, and lost productivity, the annual benefit equals $120,000. That figure can sit alongside your tangible benefits with a clear assumption log attached.
Some intangibles resist monetization entirely. When that happens, keep them qualitative but visible.
Include a narrative section in your final recommendation that explains how these factors influenced the decision, even if they do not appear in the net benefit calculation.
Stakeholders appreciate transparency about what the numbers capture and what they do not.
4. Calculate net benefits and compare alternatives
It's time to do the math.

Subtract the total costs from the total benefits to find the net benefit of each option. This comparison is the heart of your analysis—it shows you which choices give you the most financial upside.
But remember, it's not just about the final figure. Take the time to understand the story behind the numbers.
Which option has the highest net benefit?
Does it align with your strategic goals?
Are there any non-financial factors that might influence your choice?
Here's a tip: When comparing alternatives, consider using a sensitivity analysis. This will help you see how changes in key assumptions affect your net benefit.
For example, what if material costs rise by 10% or the projected revenue falls short?
By testing these scenarios, you'll get a sense of how robust your findings are and whether one option might be safer than another in the face of uncertainty.
5. Make recommendations based on findings
Armed with your calculations, you can now recommend the most financially sound option. Your findings should support a clear path forward, providing a compelling case for why your chosen alternative stands out among the rest.
Keep in mind that a cost-benefit analysis balances the cost of an action against its potential benefits. This balance is crucial in guiding your recommendations.
As you make your recommendations, be transparent about your assumptions and the potential risks involved.
Highlight how the benefits of your chosen option outweigh the costs, not just in monetary ways but also in terms of meeting strategic objectives or other non-financial benefits.
Tailor your recommendations to your audience. Whether it's a board of directors, a team of executives, or another decision-making body, make sure your presentation of findings resonates with their priorities and concerns.
This will help ensure that your cost-benefit analysis is not just a set of numbers, but a persuasive tool for making informed and strategic decisions.
Finance Alliance Pro Membership
Tired of feeling stagnant in your FP&A career? Take control and unlock your true potential with the Finance Alliance Pro Membership and:
- Engage in high-level discussions with peers, sparking innovative ideas and expanding your perspective.
- Sharpen your skills with access to advanced financial analysis tools and expert-curated resources. ️
- Unlock exclusive career opportunities within a network of industry leaders.
Don't just survive your career, thrive in it.
Join Finance Alliance Pro Membership today! 🎓


Finance alliance insider
Thank you for subscribing
Level up your finance alliance career & network with finance alliance experts.
An email has been successfully sent to confirm your subscription.
 Follow us on LinkedIn