Want to know how to evaluate the financial performance of a company?
Even if you're experienced, there are a few important things about measuring financial performance that even the experts can overlook.
In this blog post, we’re digging into three things every CFO should know about financial performance analysis.
Table of contents:
- What is financial performance analysis?
- Five must-have documents to evaluate financial performance
- 10 important financial performance metrics to monitor and assess
- Four areas that are the best measure of a company’s financial health
What is financial performance analysis?
Financial performance analysis is an evaluation of a company’s financial standing. It considers a range of categories such as assets, equity, expenses, liabilities, revenue, and profitability.
The evaluation usually reviews the financial standing of the company over a specific time period.
To evaluate the financial performance analysis of a company properly, you’ll need a deep understanding of the following:
- The overall structure of financial statements: You need to know how they work and what each part of the statement means.
- Potential areas of concern to help mitigate risk and prepare for a more profitable future for the company.
- How the company works and the entire industry the company operates in. This means always being on the pulse of your industry’s latest trends. You should also try to keep up with competitors or better yet, stay one step ahead of them.
When done right, financial performance analysis can help organizations make better decisions that lead to business growth and profitability.

Alright, that’s enough small talk. Let’s get into the three things every CFO must know about performing a financial performance analysis:
1. Five must-have documents to perform financial performance analysis
First up, let’s talk about paperwork… sort of. When analyzing financial performance, you need a handful of important documents that may or may not be actual hard copies.
Most businesses are embracing the whole ‘digital transformation’ era lately. So, there’s a good chance all the documents you need will be stored in your company’s online filing system. Therefore, the first step is to find them.
Here are some of the documents you’ll need to carry out a financial performance analysis:
Balance sheet – this handy document reveals how the company is performing financially on a macro-level.
Income statement – you’ll need this to track company expenses. Consider things like sales revenue, gross profit, cost of goods sold, and so on.
Cash flow statement – you can’t calculate a company’s liquidity without the cash flow statement. Well, you probably could, but it’ll take you a very long time. So, get your hands on the cash flow statement and use it to track net income, receivables, and debt.
Profit and loss (P&L) statement – the P&L statement gives you insights that can be used to check and balance other documentation.
General ledger – okay, this one isn’t 100% necessary. However, it's useful because you can use it to pinpoint the causes of any discrepancies.

2. 10 important financial performance metrics to monitor and assess
Here are 10 essential metrics to analyze the financial performance of a company:
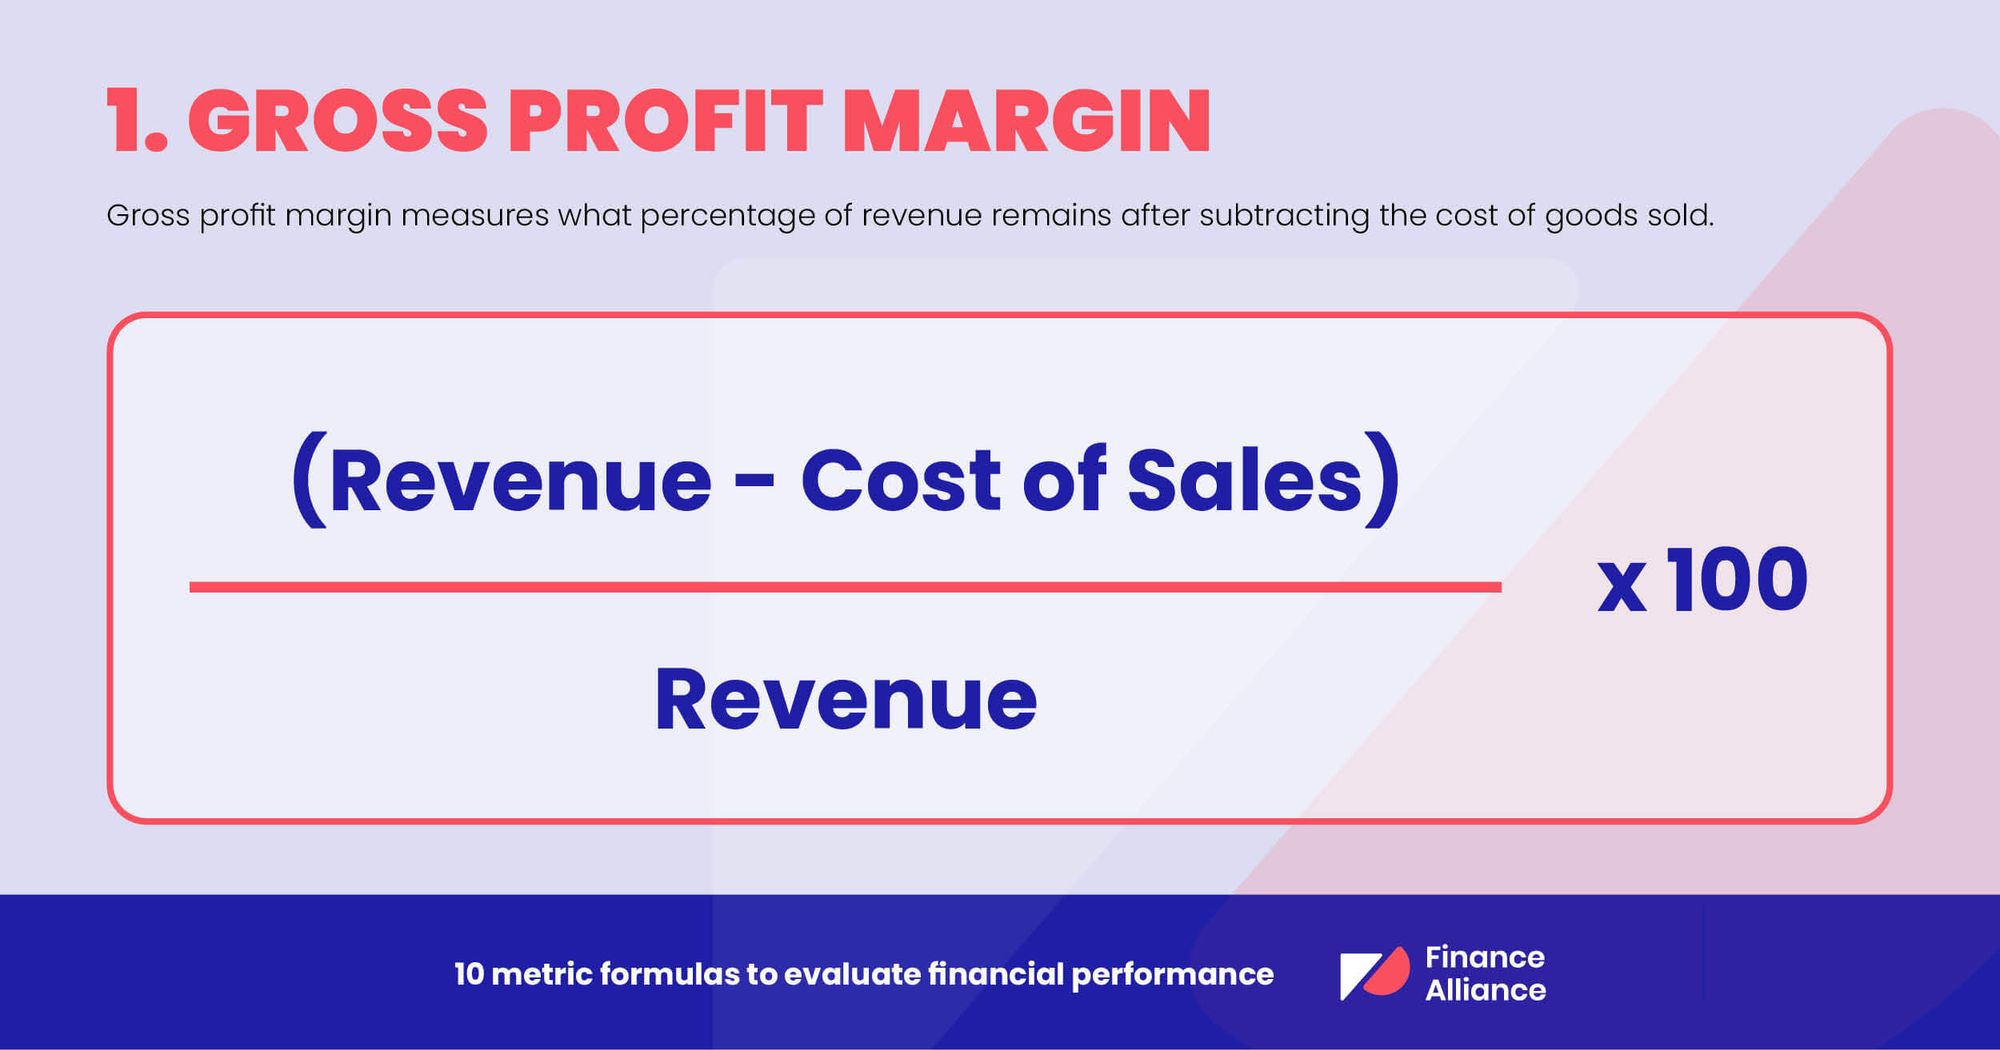
1. Gross profit margin
Gross profit margin measures the percentage of revenue after subtracting the cost of goods sold. Keep in mind that the cost of goods sold doesn’t include things like operating expenses or taxes. Rather, the gross profit margin is a profitability measure.
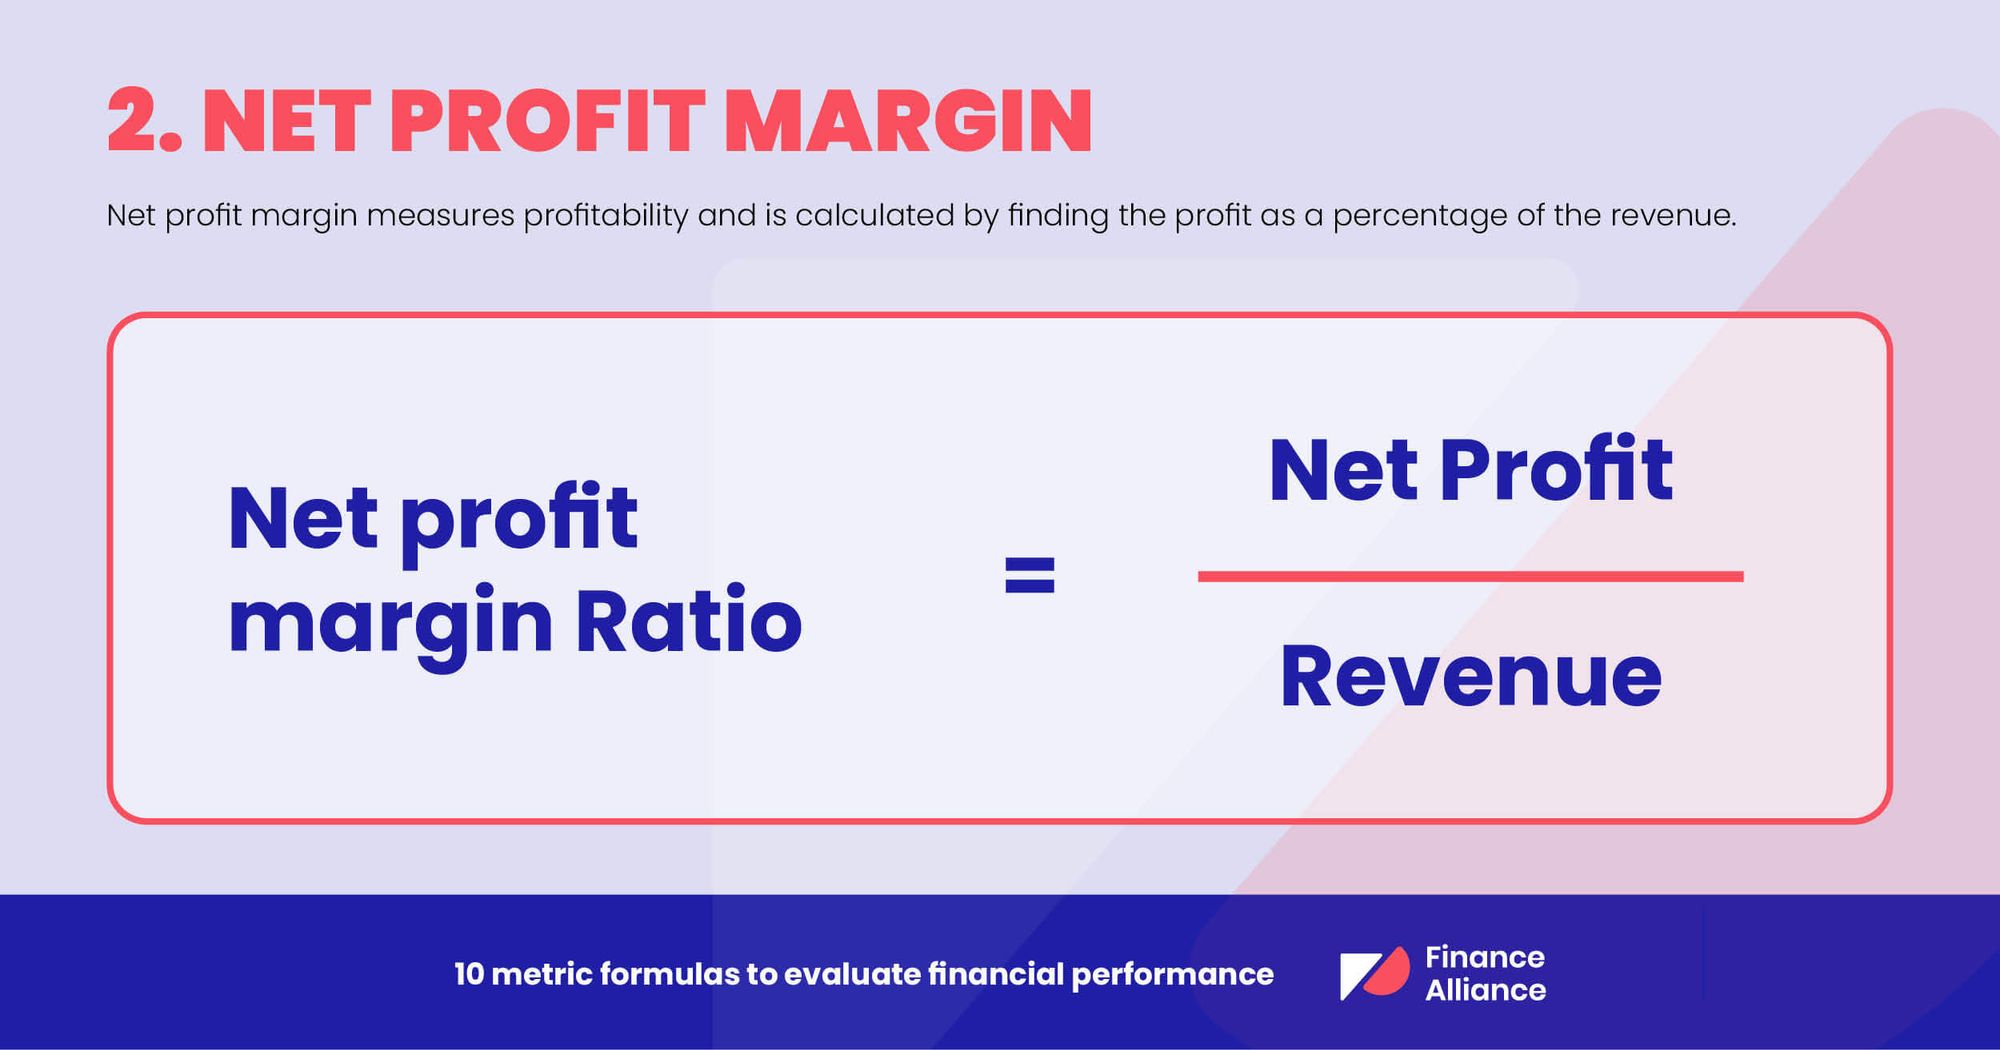
2. Net profit margin
Net profit margin measures profitability and is calculated by finding the profit as a percentage of the revenue. It’s not to be confused with gross profit margin. Net profit margin is a measure of profitability for the overall business and takes other expenses into account.
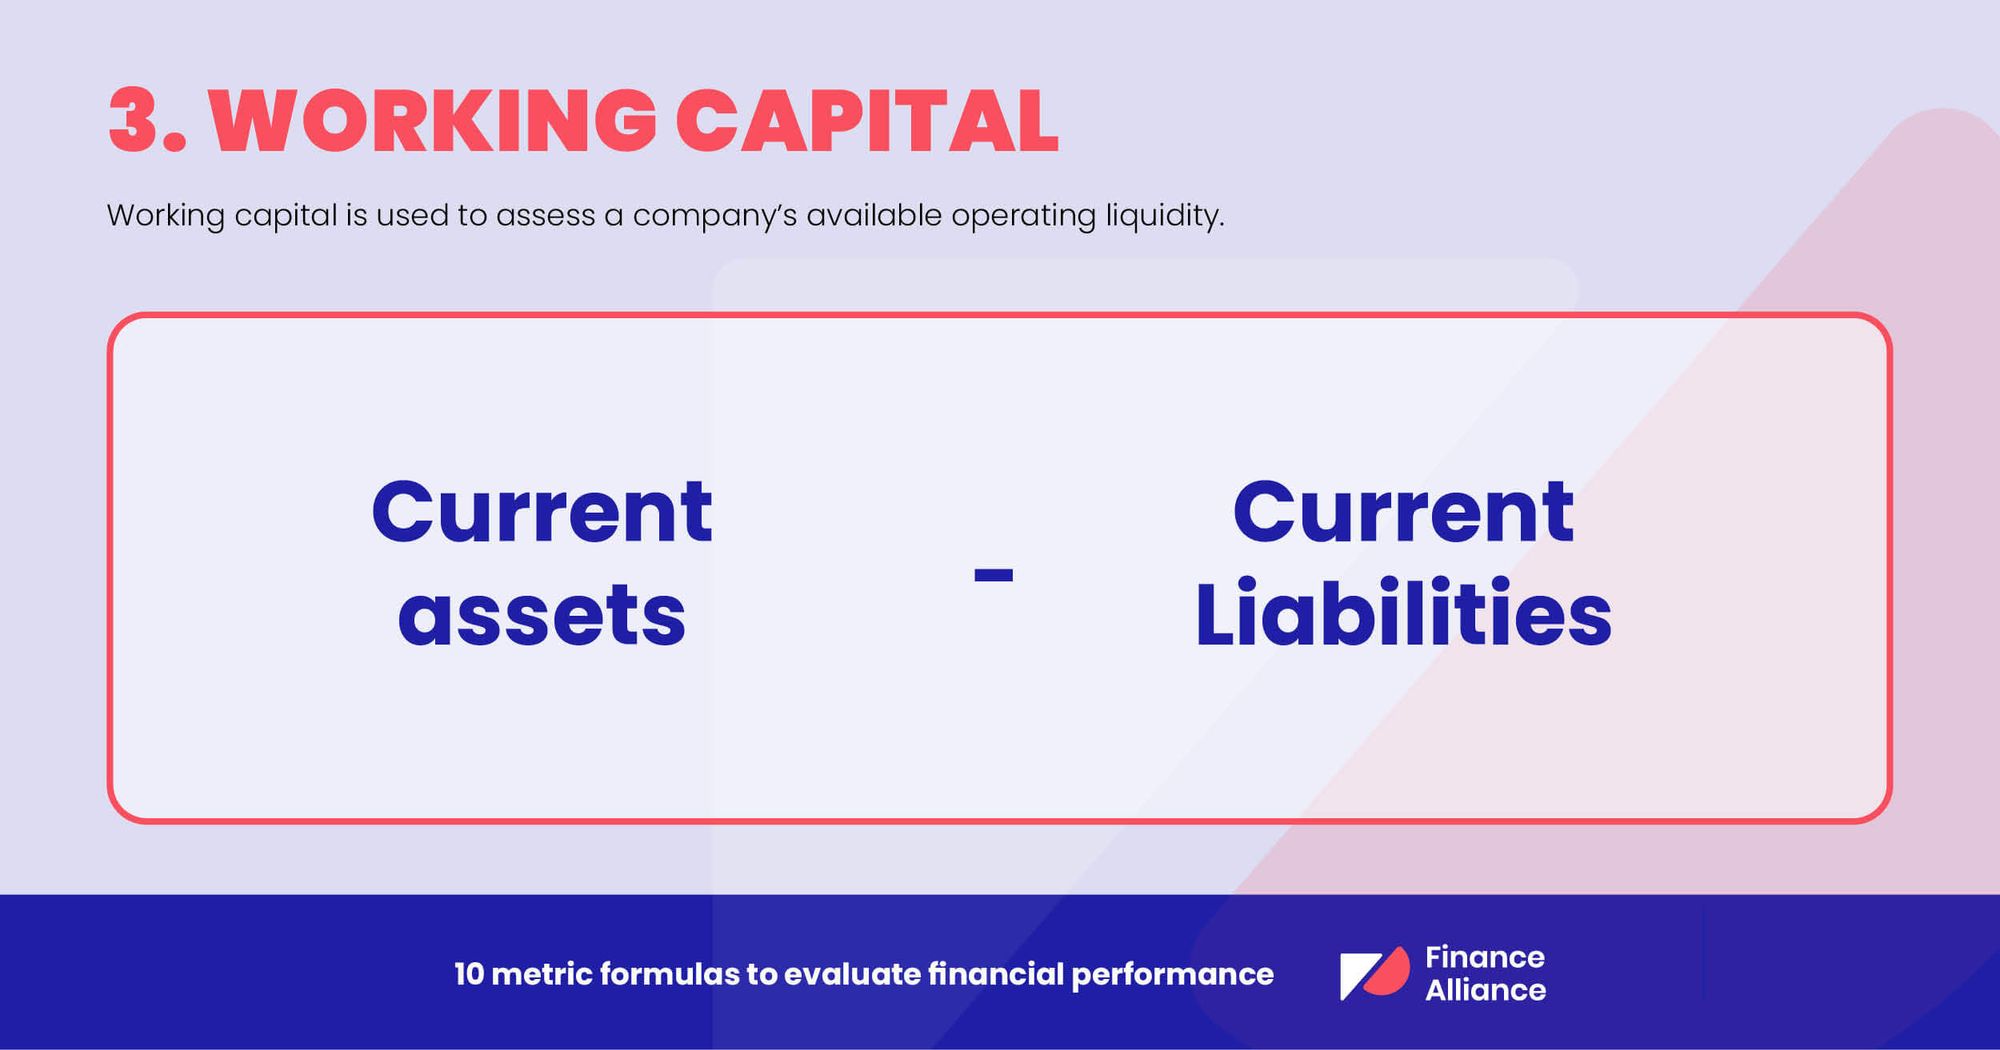
3. Working capital
Working capital is used to assess a company’s available operating liquidity. This amount can be used to fund things like the daily operations of the business. It's calculated by subtracting current liabilities from current assets.
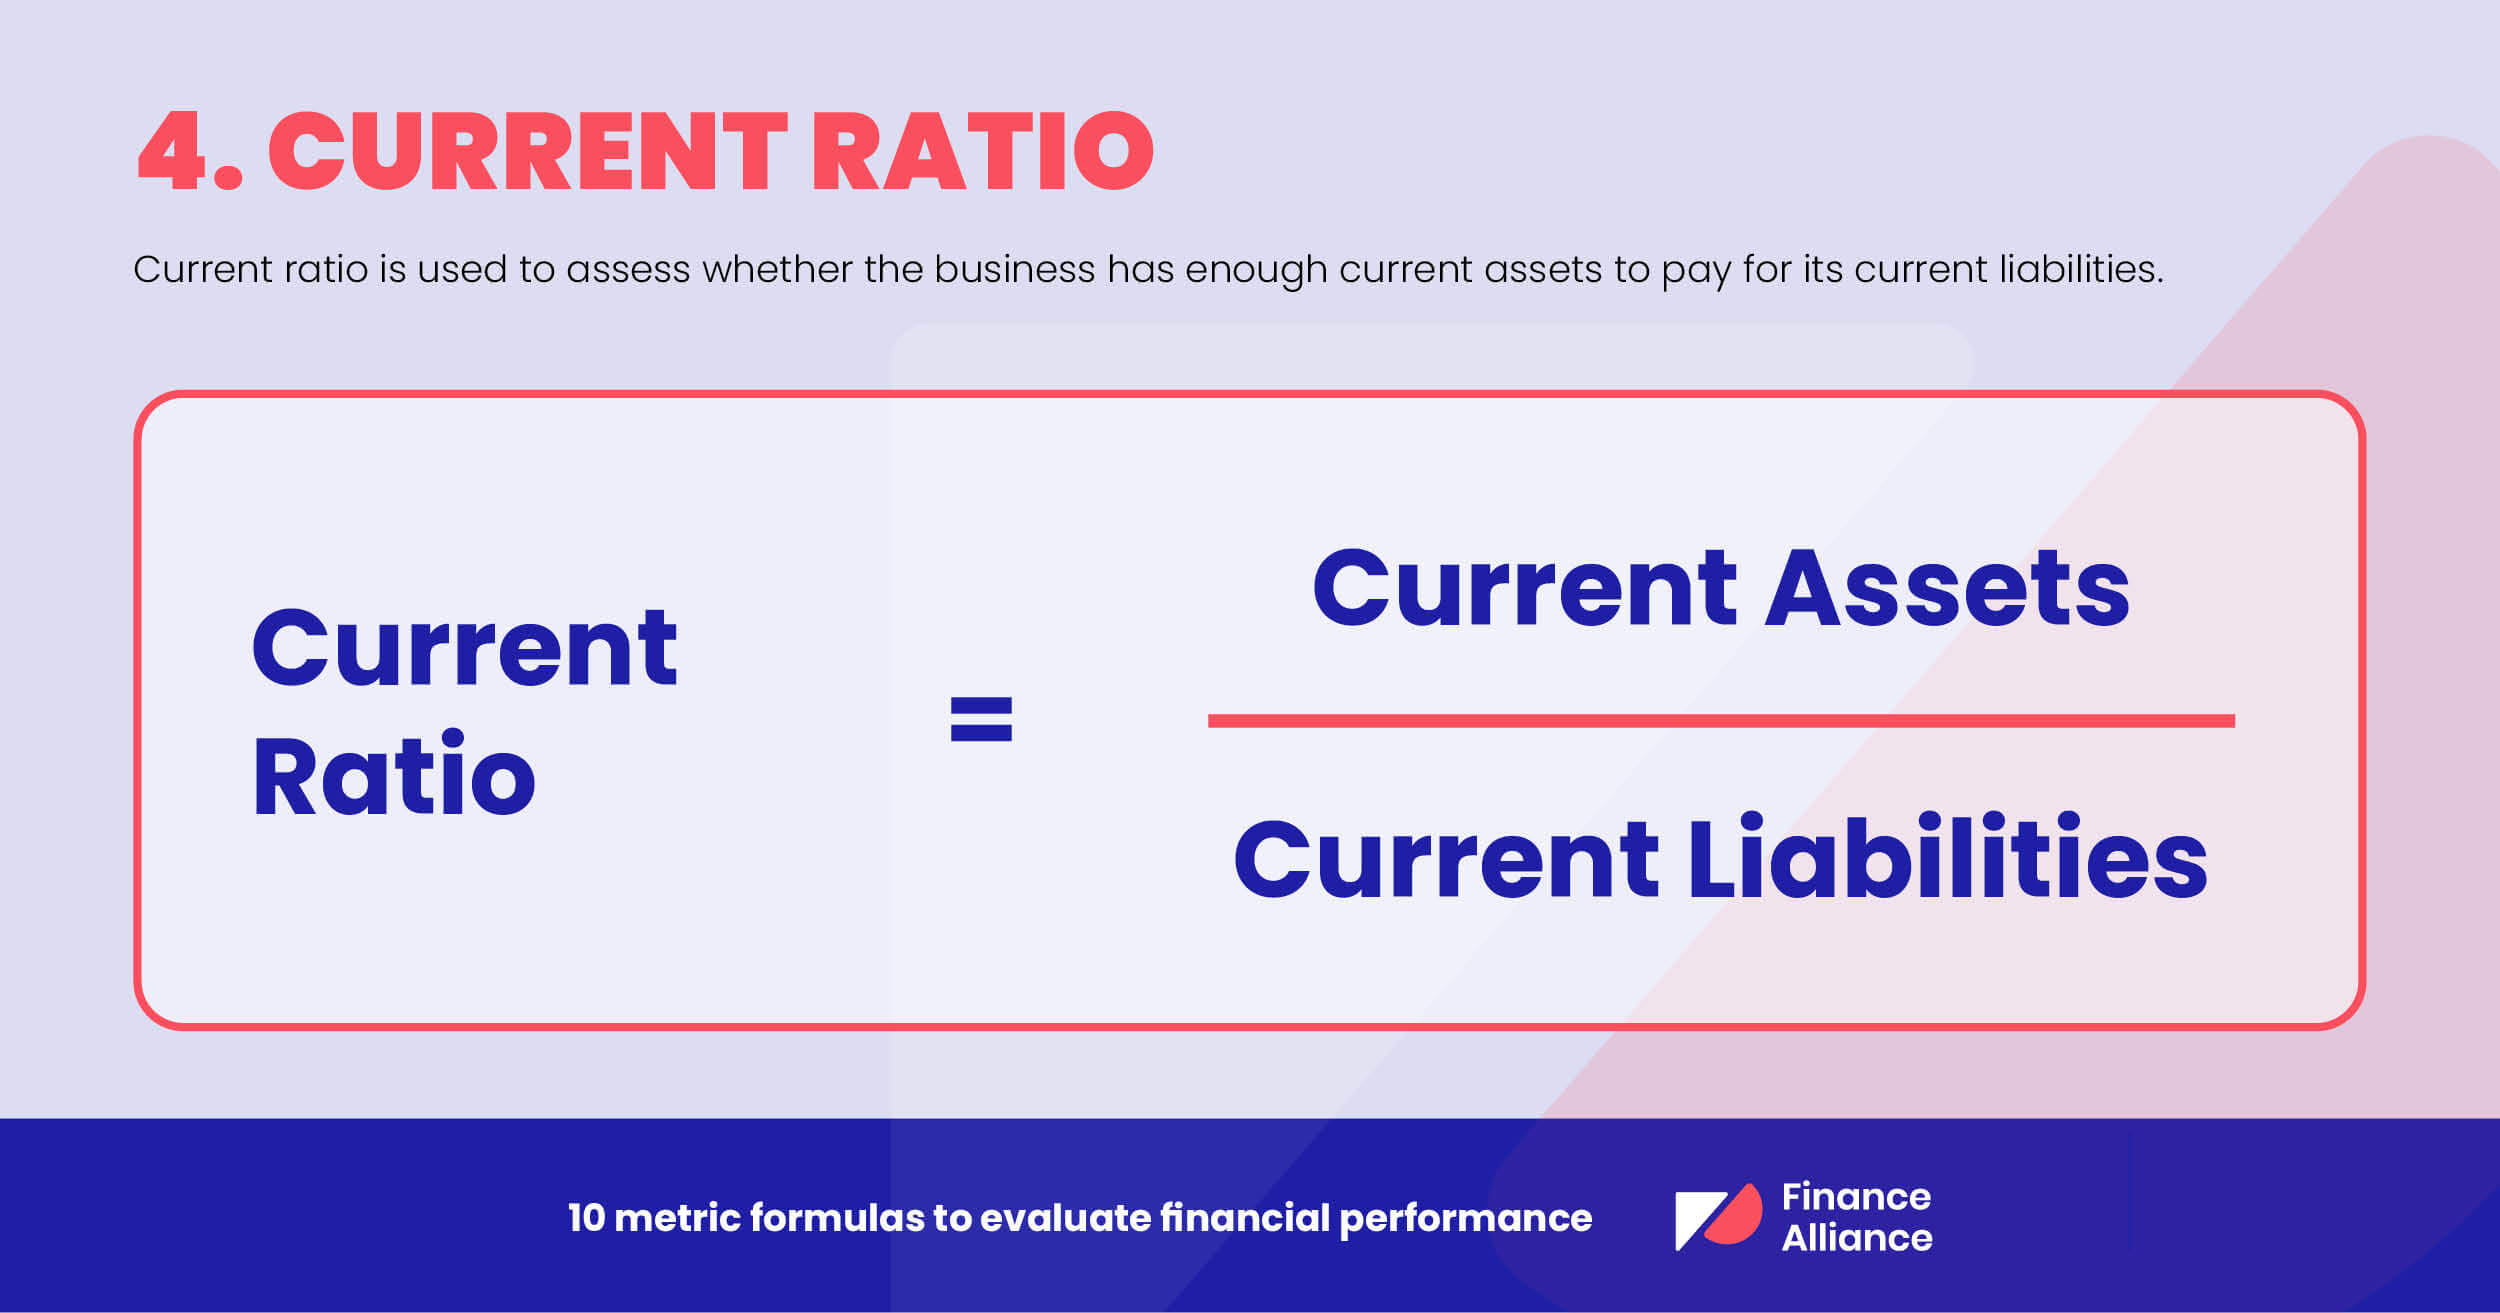
4. Current ratio
Current ratio refers to the liquidity ratio. It's used to assess whether a business has enough current assets to pay for its current liabilities.
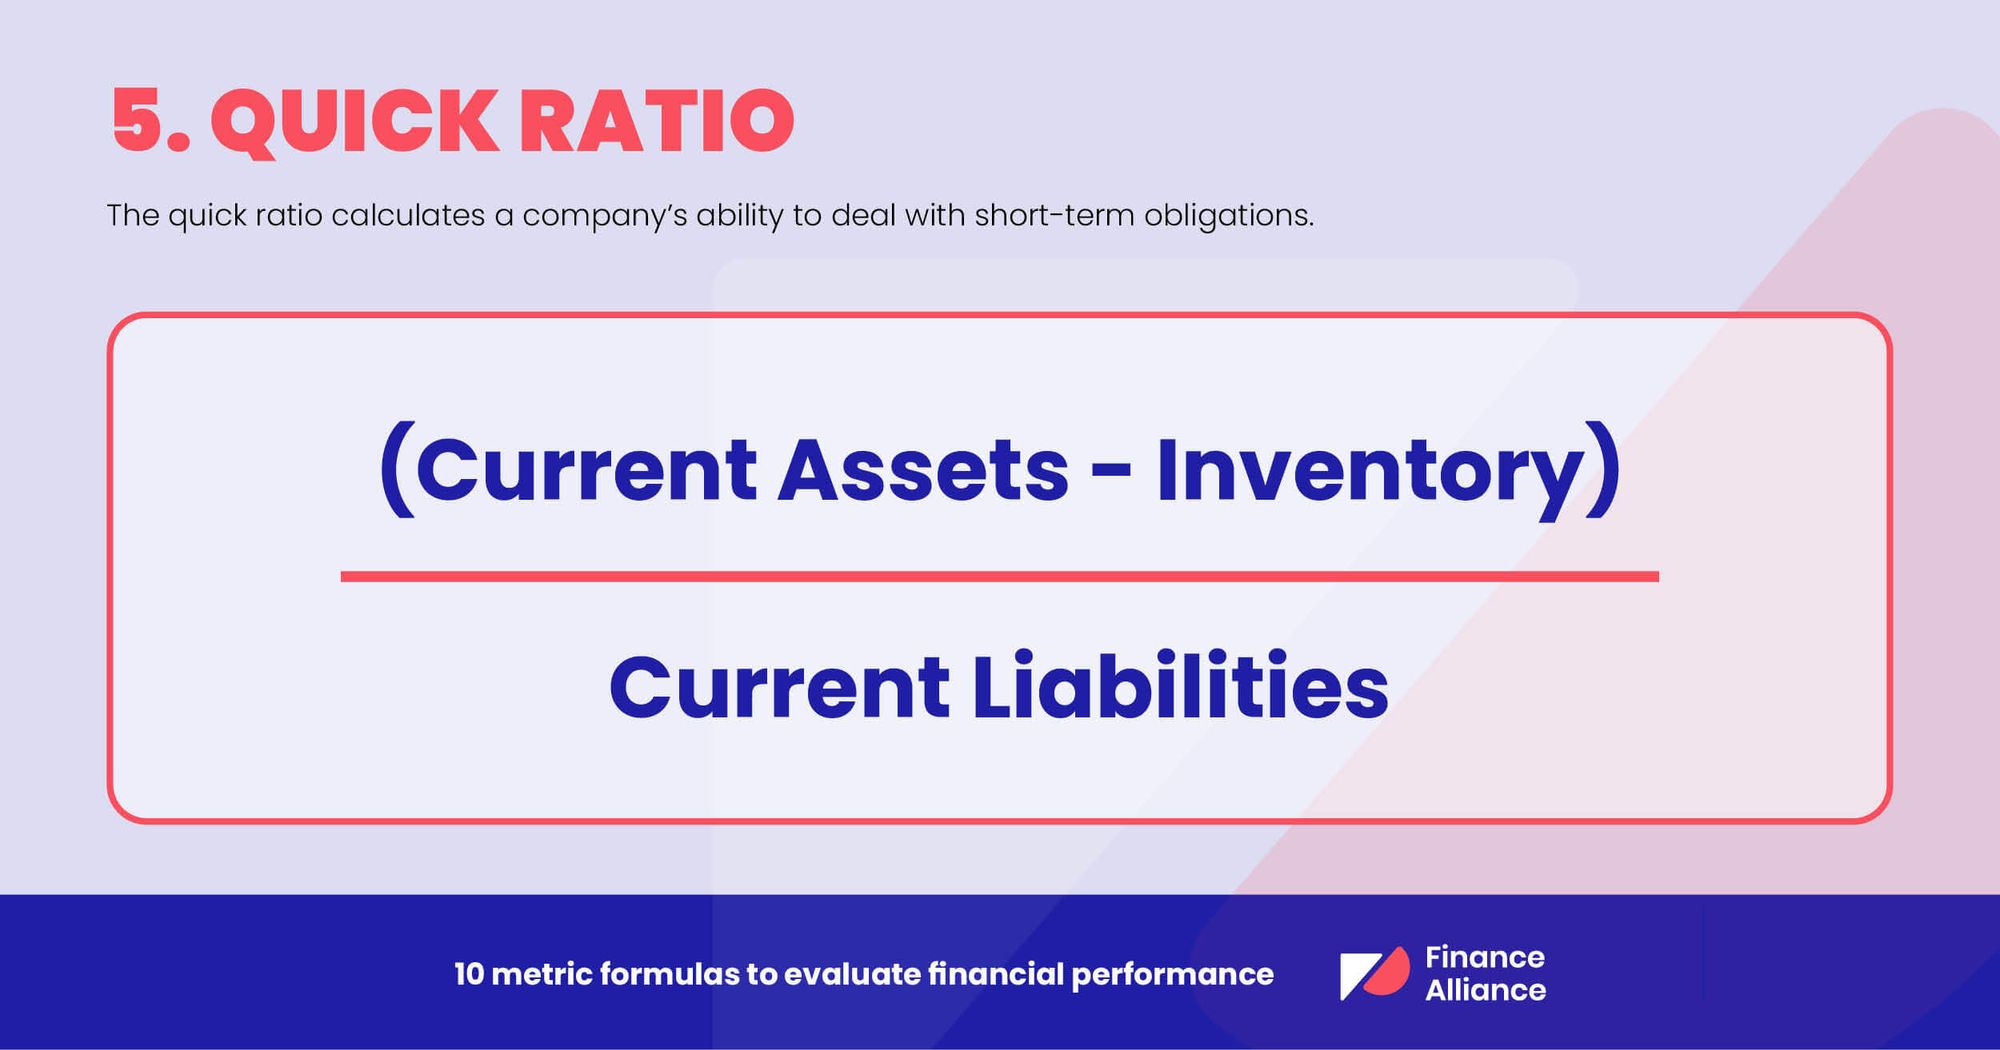
5. Quick ratio
Otherwise known as an acid test ratio, the quick ratio is a liquidity ratio. It calculates a company’s ability to deal with short-term obligations. It focuses on highly liquid current assets, including cash, marketable securities, and accounts receivables.
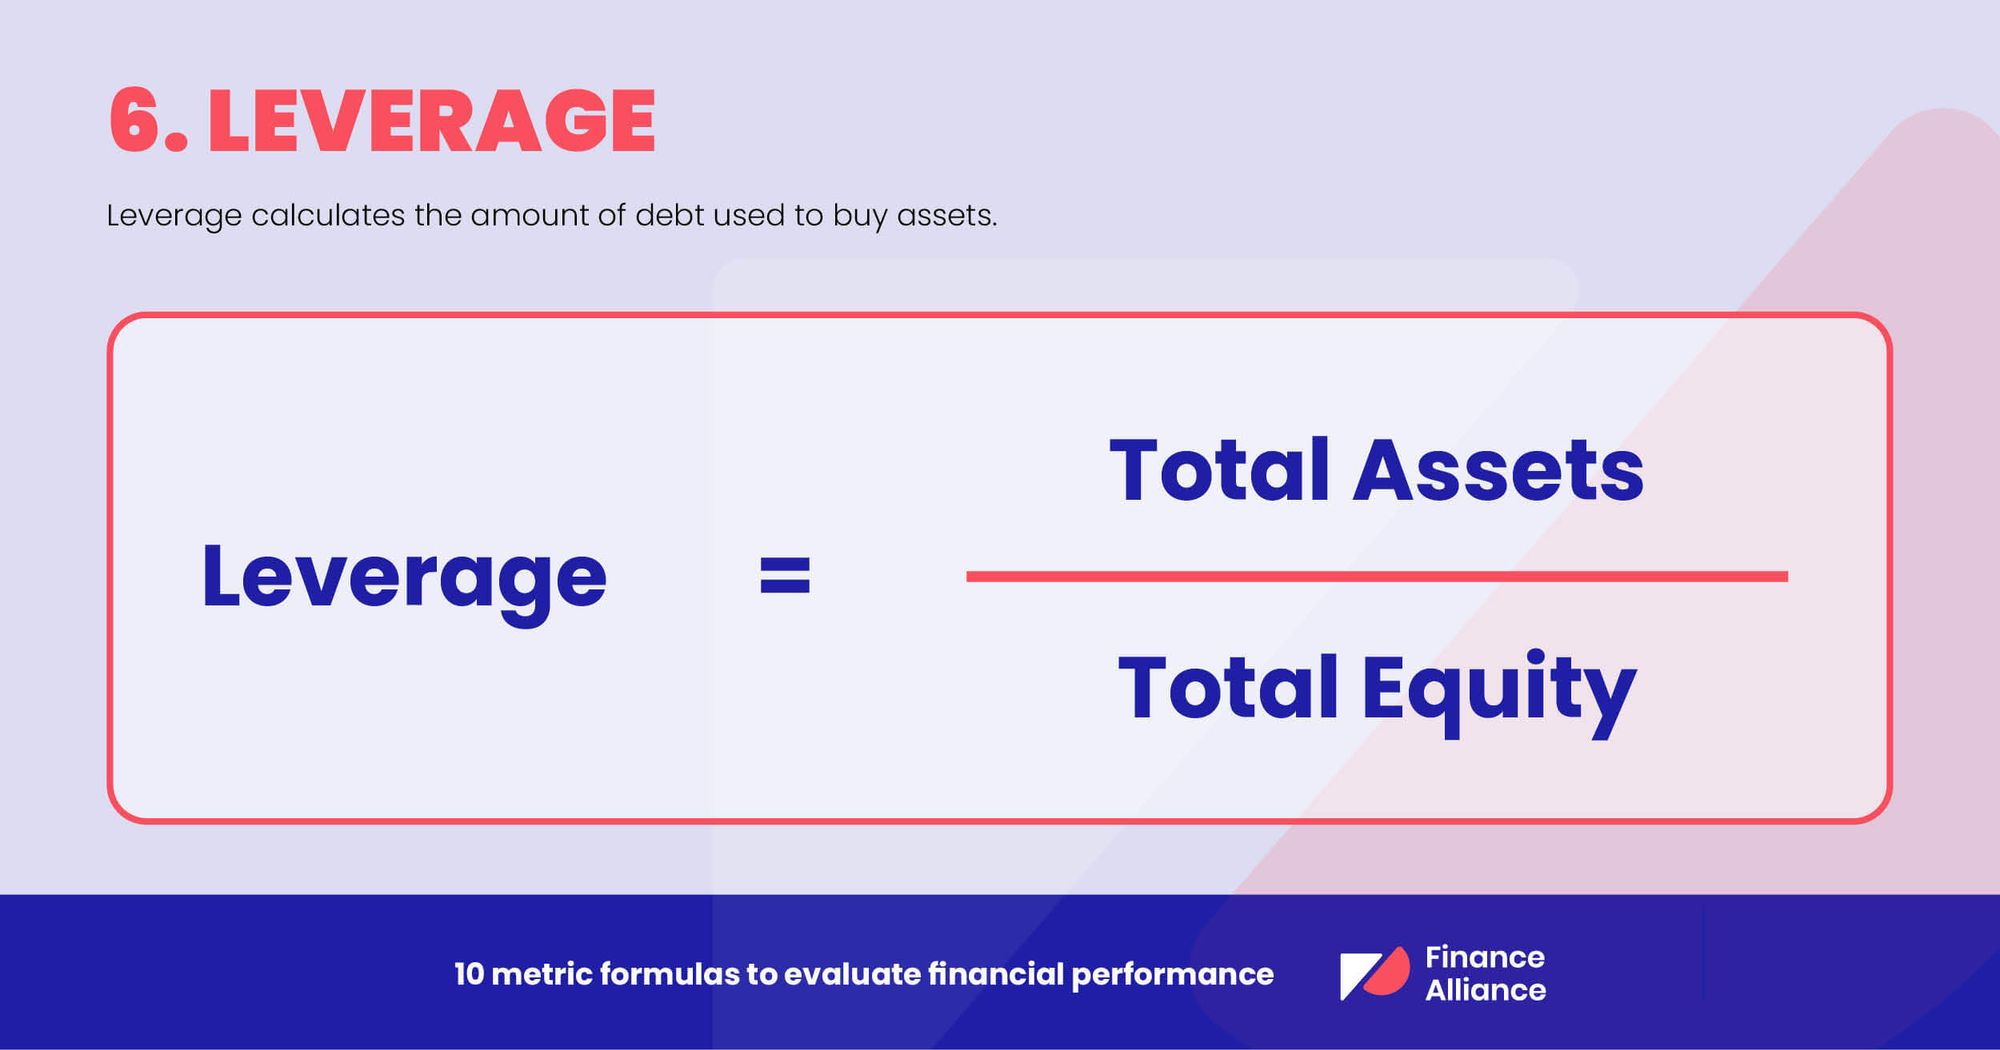
6. Leverage
Leverage calculates the amount of debt used to buy assets. It’s an equity multiplier and will increase as more debt is used to buy assets.
7. Return on equity
Return on equity evaluates the equity effectiveness, which indicates how much profit investors will subsequently earn. A higher return on equity is a good sign. It indicates that investors earn more at an efficient rate. In turn, this makes the entire business more profitable.

8. Return on assets
Return on assets reveals how effectively a company’s assets are being employed to generate more profit. A low return on assets is a clear indication that the company’s assets aren’t being used effectively.

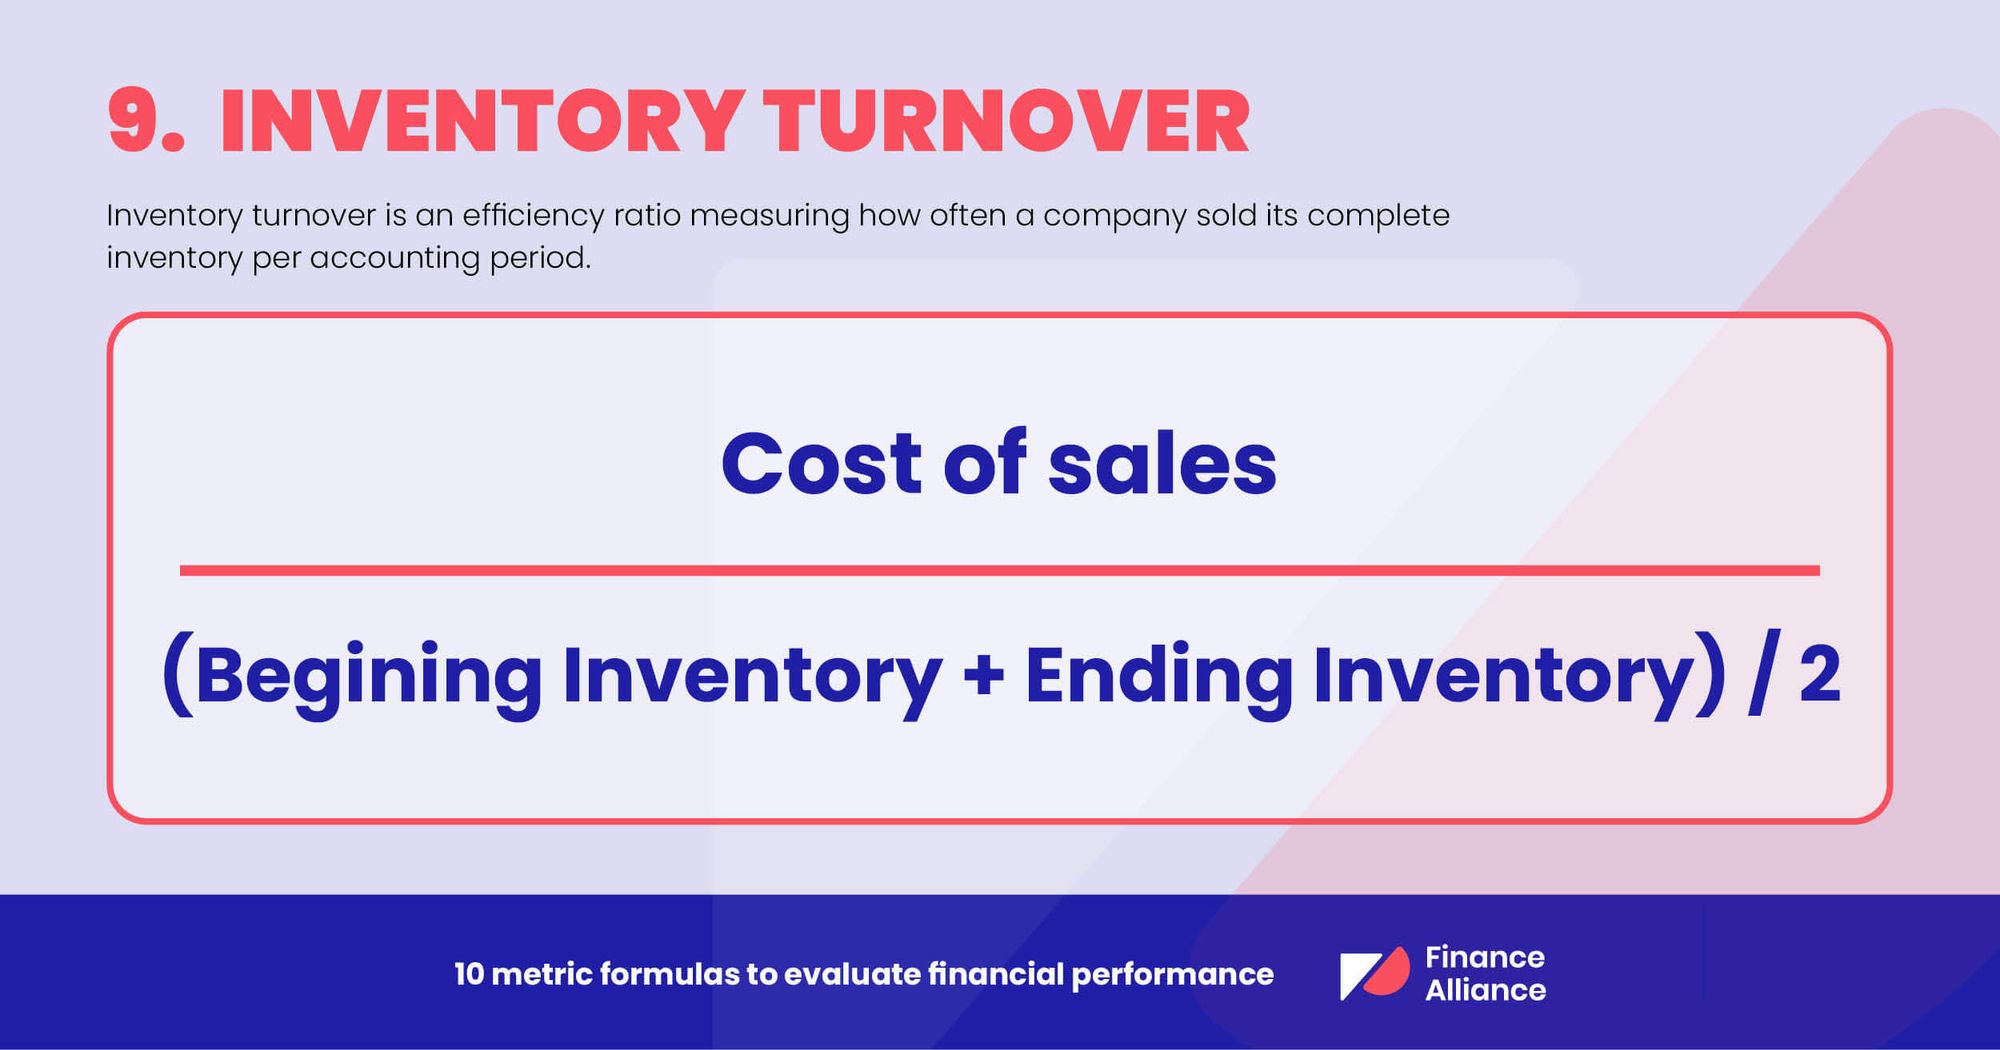
9. Inventory turnover
Inventory turnover is an efficiency ratio measuring how often a company sells its complete inventory per accounting period.
10. Operating cash flow
Operating cash flow measures how much cash the business has as a direct result of business operations. You’ll find operating cash flow in the cash flow statement.

Want to have a look at all of these financial performance metrics in one place? Check out our infographic - 10 financial performance metrics & calculations.

3. Four areas that are the best measure of a company’s financial health
There’s no ultimate way to evaluate the financial performance of a company. How one company assesses financial health can be completely different from how another company does it.
However, there are a few vital areas of financial well-being that you should assess in combination with each other. These four things are:
- Liquidity
- Solvency
- Profitability
- Operating efficiency
Now, let’s explore each one in more detail and find out why they’re so important:
Liquidity
Liquidity refers to a company’s ability to raise cash when necessary. What determines a company’s liquidity position is its ability to convert assets to cash. If a company can do this, it’s a sign that it can pay its current liabilities. If a company can’t survive in the short term, it’s not going to last very long.
Solvency
Can the company meet its debt obligations long-term? Solvency is key when measuring the financial health of any organization. When you’re carrying out financial performance analysis, always check the company’s solvency performance. Find out if the company can meet long-term financial obligations and debts.
Profitability
All companies need to be profitable to be successful. Sure, start-ups can rely on investors and creditors to carry them through the dark ages of starting a new business. But, if a company is to survive long-term, it must be profitable.
A company’s bottom line is vital to the overall financial performance and health of the company. The best metric to calculate a company’s net profitability is the net margin.
Operating efficiency
How efficient is your organization? Operating efficiency is a key metric to track in your financial performance analysis. It reveals how efficiently a company’s operations run and how well management controls costs.

Key takeaways for a successful financial performance analysis
1. Financial performance analysis evaluates a company’s financial standing. It helps organizations make informed decisions that lead to business growth and profitability.
2. When analyzing financial performance, you’ll need these five documents:
- Balance sheet
- Income statement
- Cash flow statement
- Profit and loss statement
- General ledger
3. Compare financial metrics historically, and against your industry, to help gain valuable insights into your company’s financial performance.
4. When carrying out financial performance analysis, make sure that you consider the company’s liquidity, solvency, profitability, and operating efficiency.
Want more great FP&A content? Check out more of our articles and resources here.


Finance alliance insider
Thank you for subscribing
Level up your finance alliance career & network with finance alliance experts.
An email has been successfully sent to confirm your subscription.
 Follow us on LinkedIn